btop — the top of my dreams
The top program is the original system monitoring and management tool for Unix and Linux. It performs its task well and with a minimum of fanfare. And there are other tools, like htop and glances, that perform this same task with varying degrees of additional features and visual style.
However, I just found btop, a text user interface (TUI) system monitoring tool. It’s not just spectacular, it’s informative, easy to understand, quite sparing of system resources, and it’s elegant. While btop might not be new to you, it is to me. According what I can infer from it’s GitHub site, btop is quite new, having been around since only about May of 2021. There are packages for most Linux distros and the BSDs.
I just installed btop a few days ago and have been playing — experimenting — with it ever since. Its broad, well designed view into the workings of Linux computers make it my new go-to monitoring application.
Installation
Installation of btop was quite easy as it’s included in the Fedora repository. I also had to install the rocm-smi package to enable btop to access the sensors on my AMD Radeon Pro GPU.
# dnf -y install btop rocm-smi btop is also available for my Raspberry Pi so I installed it there, too.
Getting started
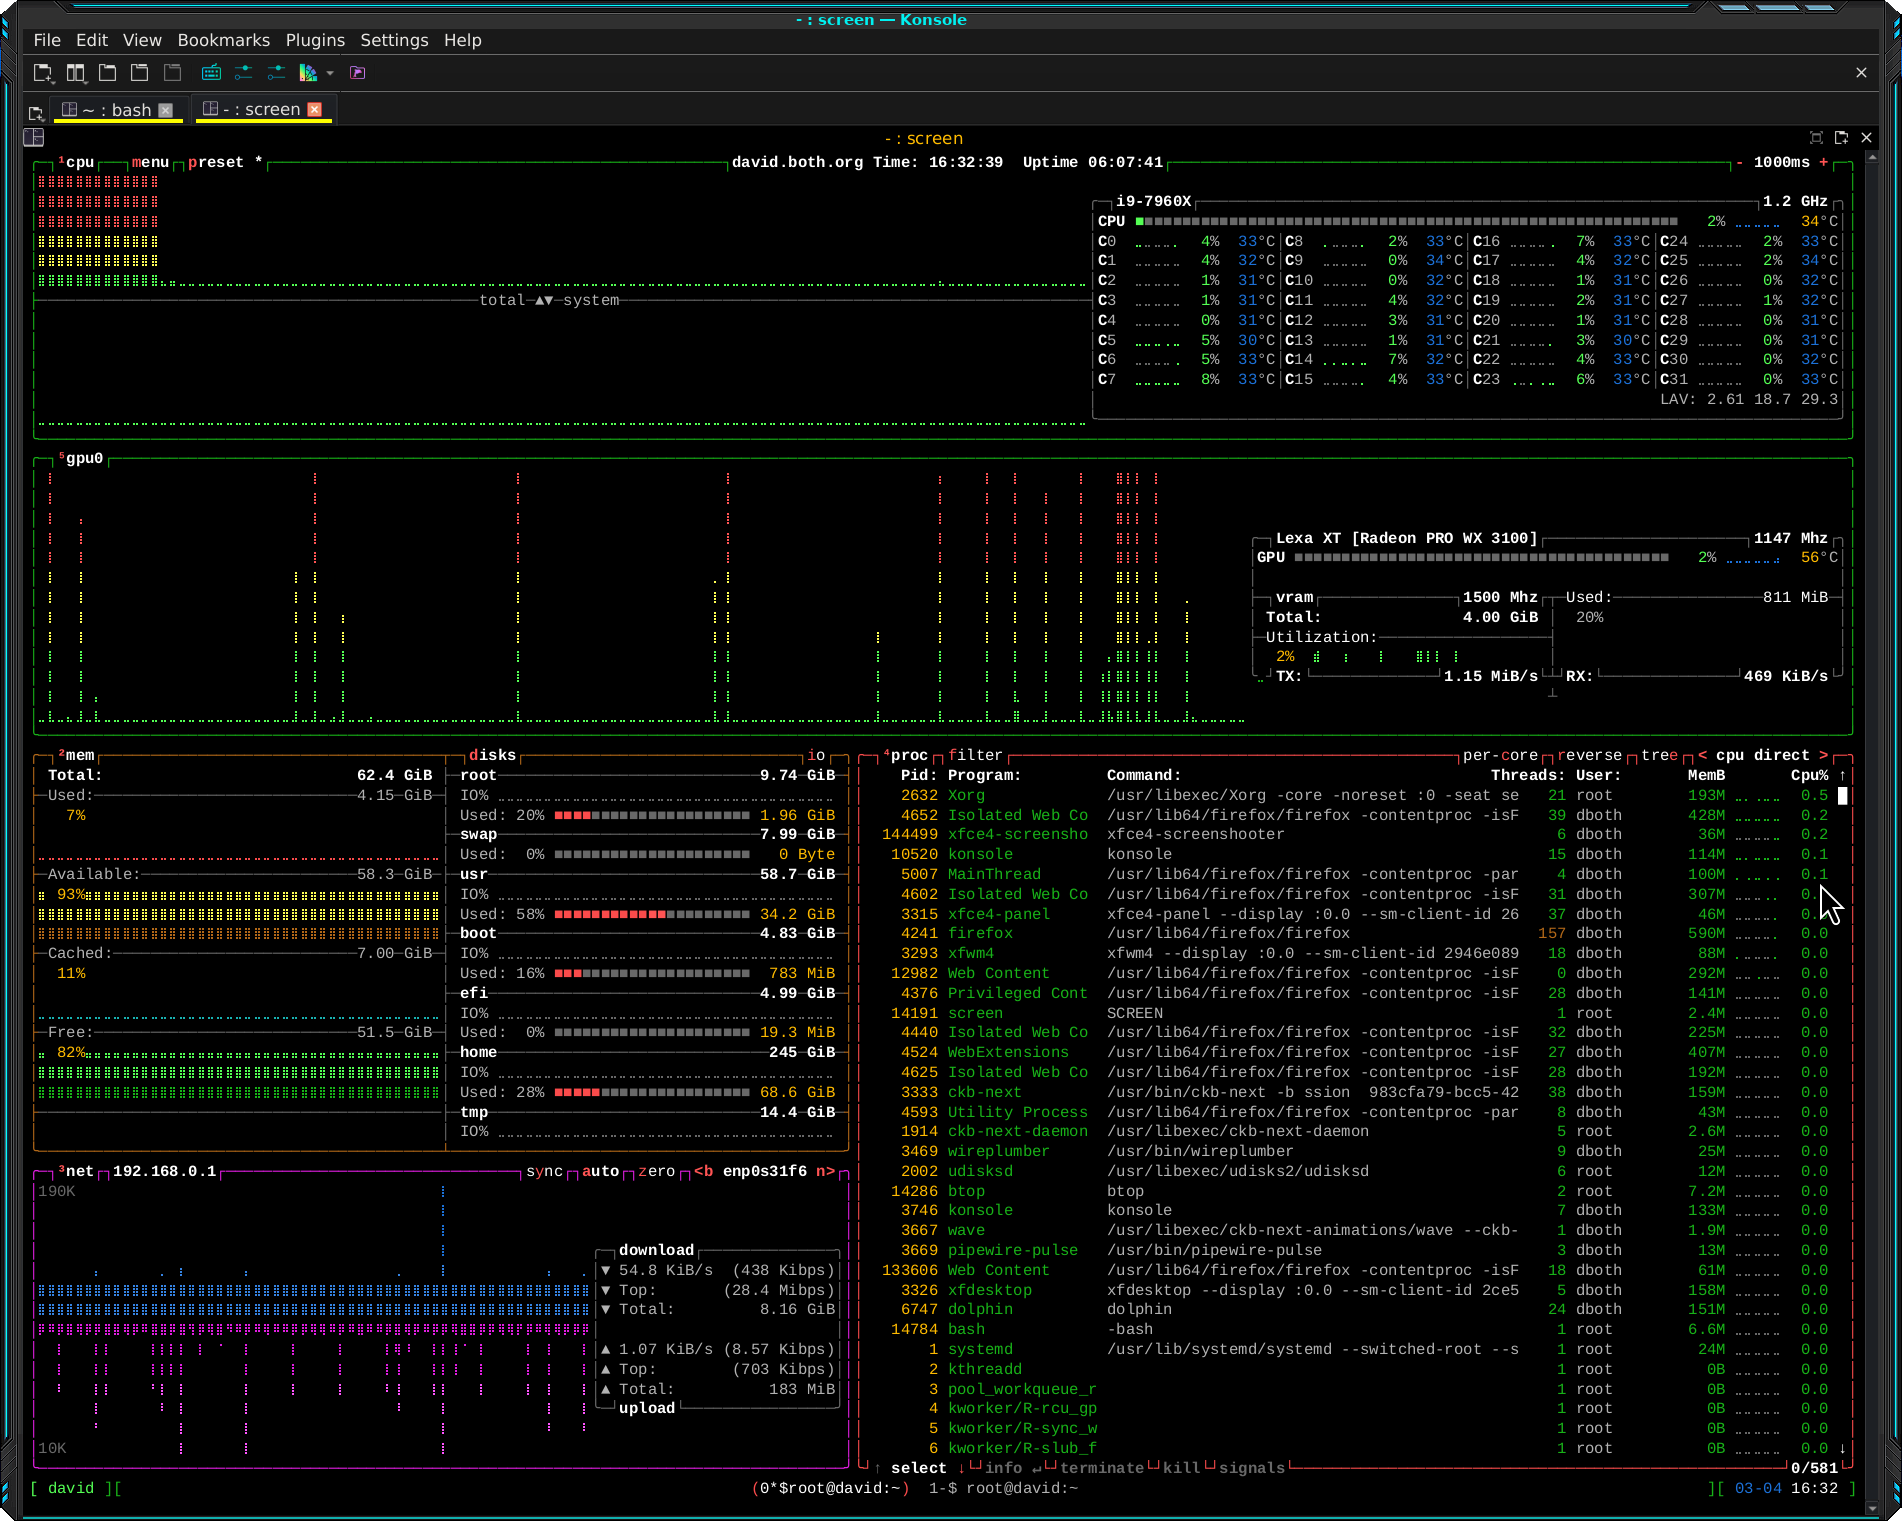
Launch btop from the command line in a terminal session and the first view of its interface, in Figure 1, is pretty amazing. Click the image to enlarge it.
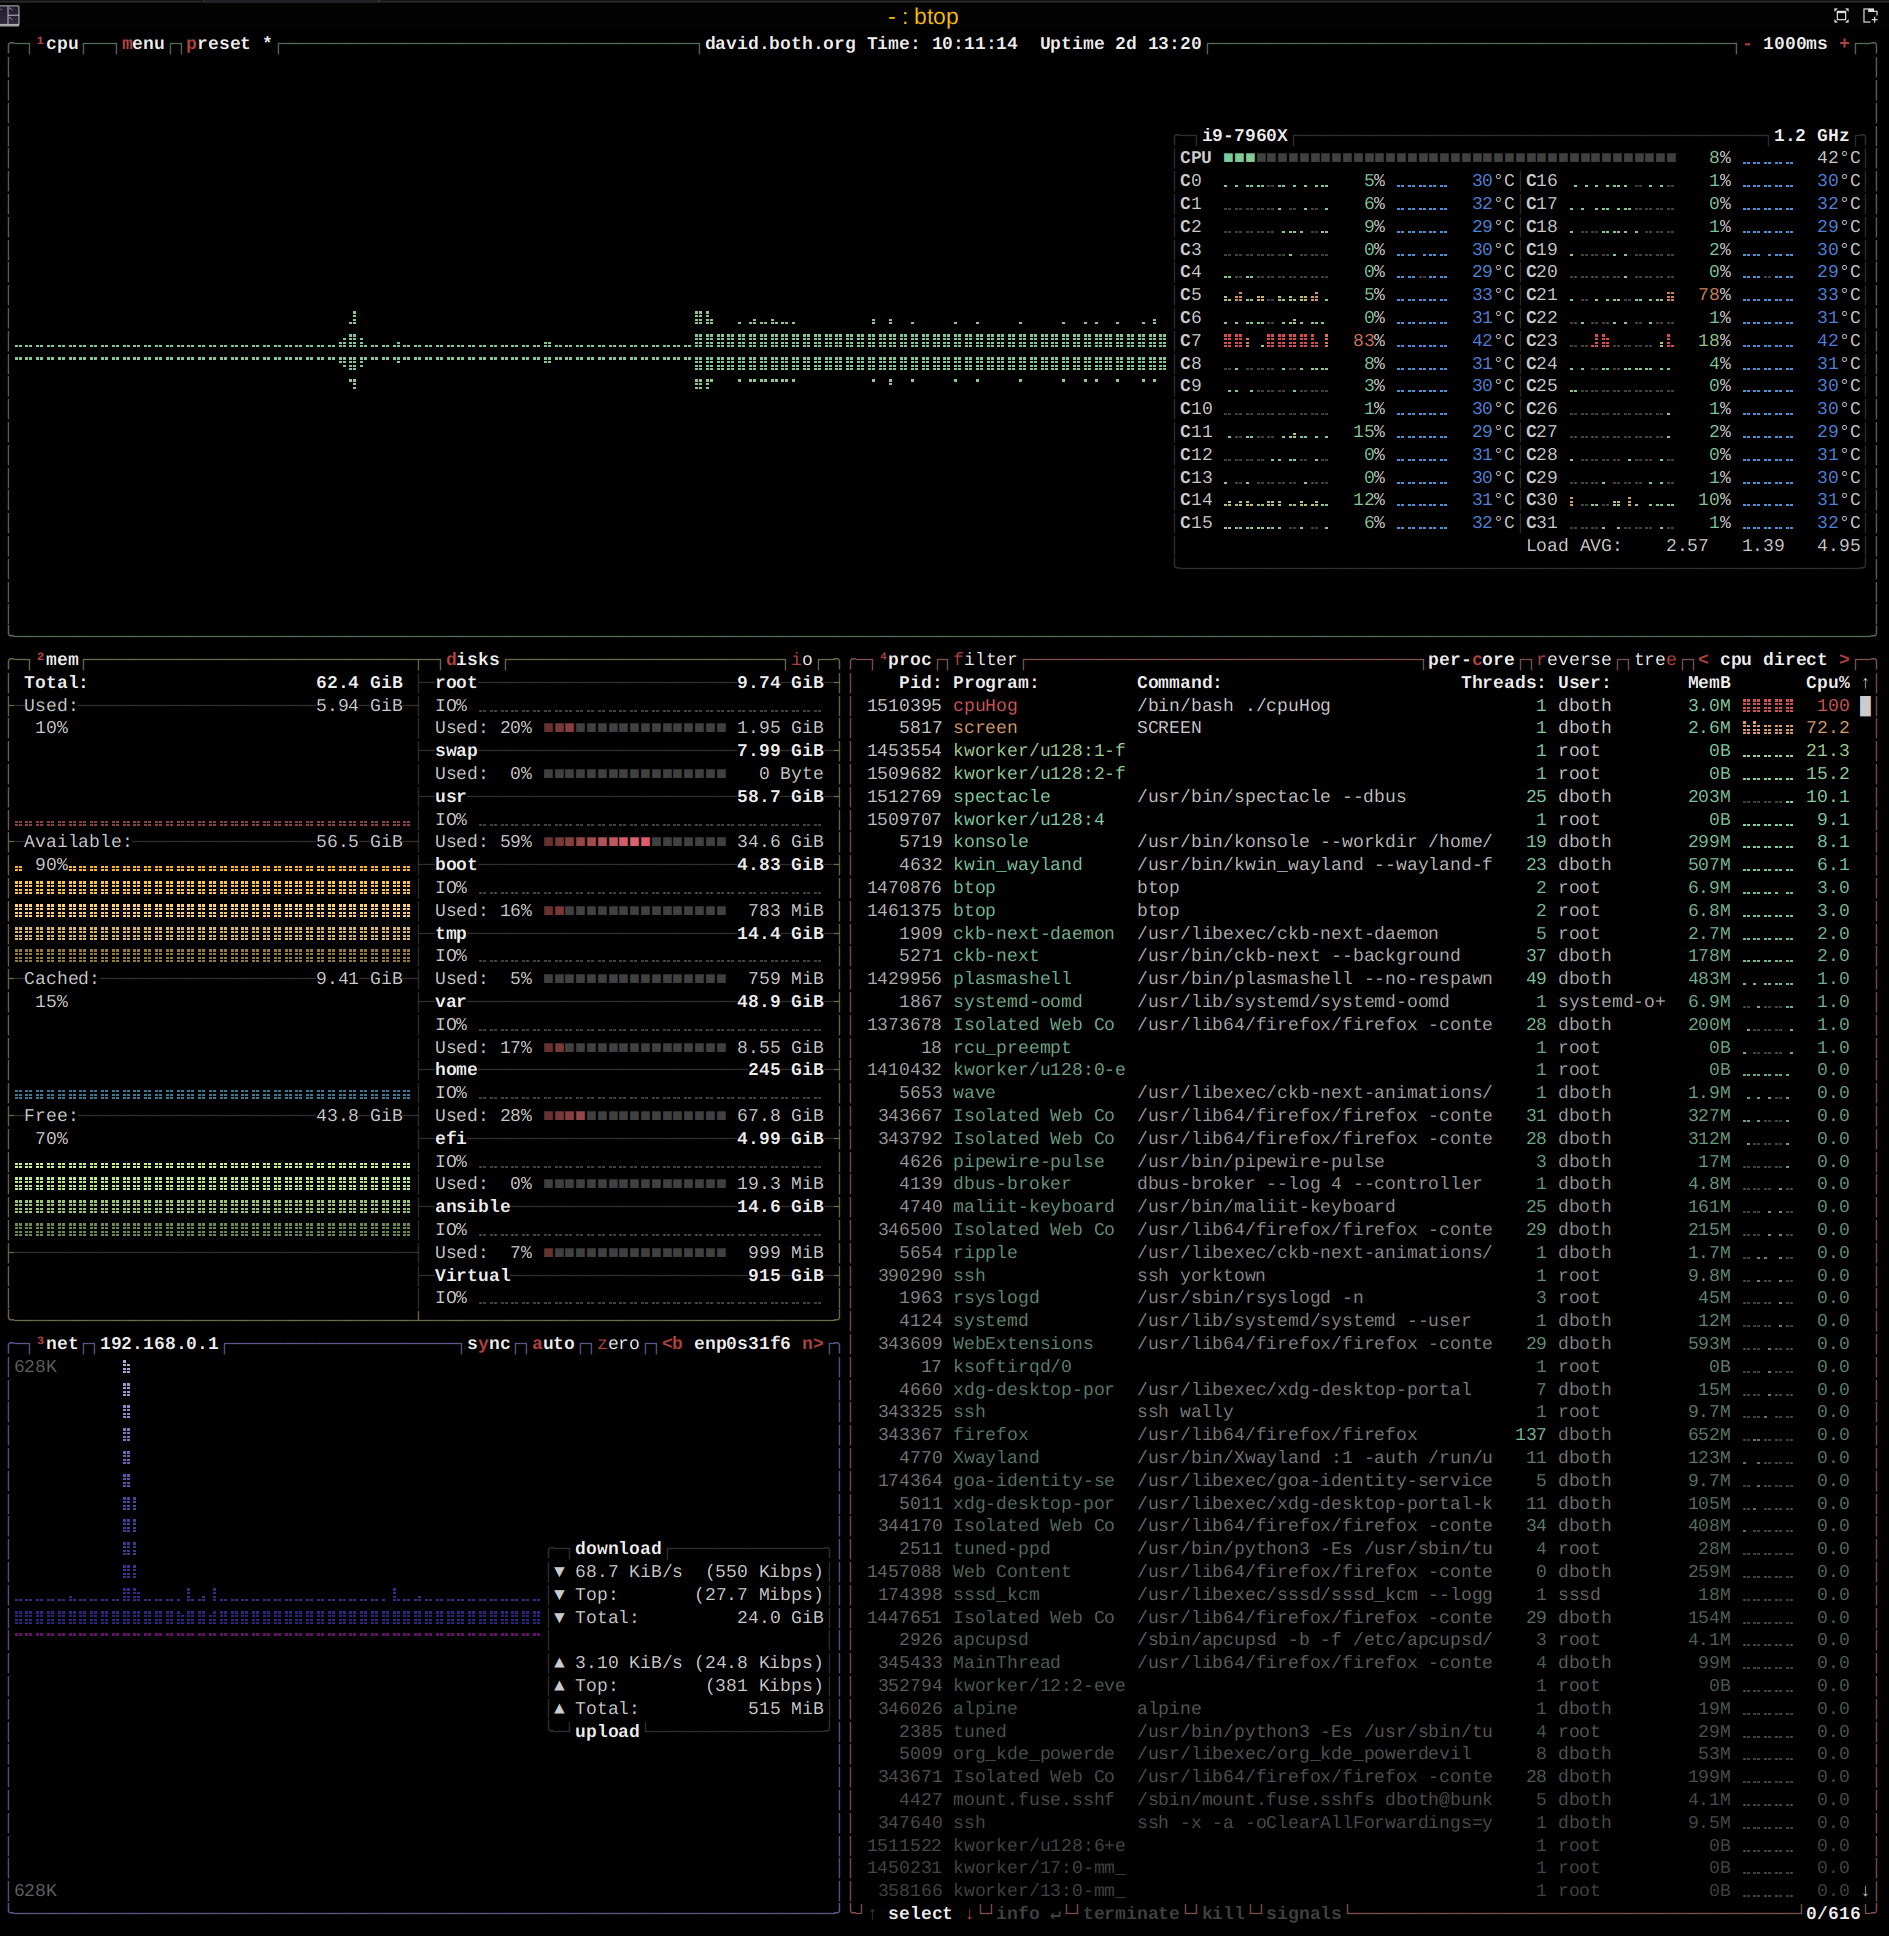
The default display consists of six distinct regions. Each region is identified by numbers 1 to 5 and the letter d. Each can be toggled between hidden and shown by pressing its ID character on the keyboard. For example, pressing the “3” key, alternately turns the network region on and off.
Region 1 is for the CPU and extends across the entire top of the screen. The left part of the CPU display contains two sub-sections. the top half of the section in Figure 1, displays a historical graph of the total CPU usage. The bottom half contains an inverted CPU usage graph. Both sections can be independently configured to display any of several graphs. On some of my systems I use “System” which displays a graph of the kernel activity. On my primary workstation, I have the bottom section configured to display average GPU usage. I also configured the bottom half so it’s not inverted.
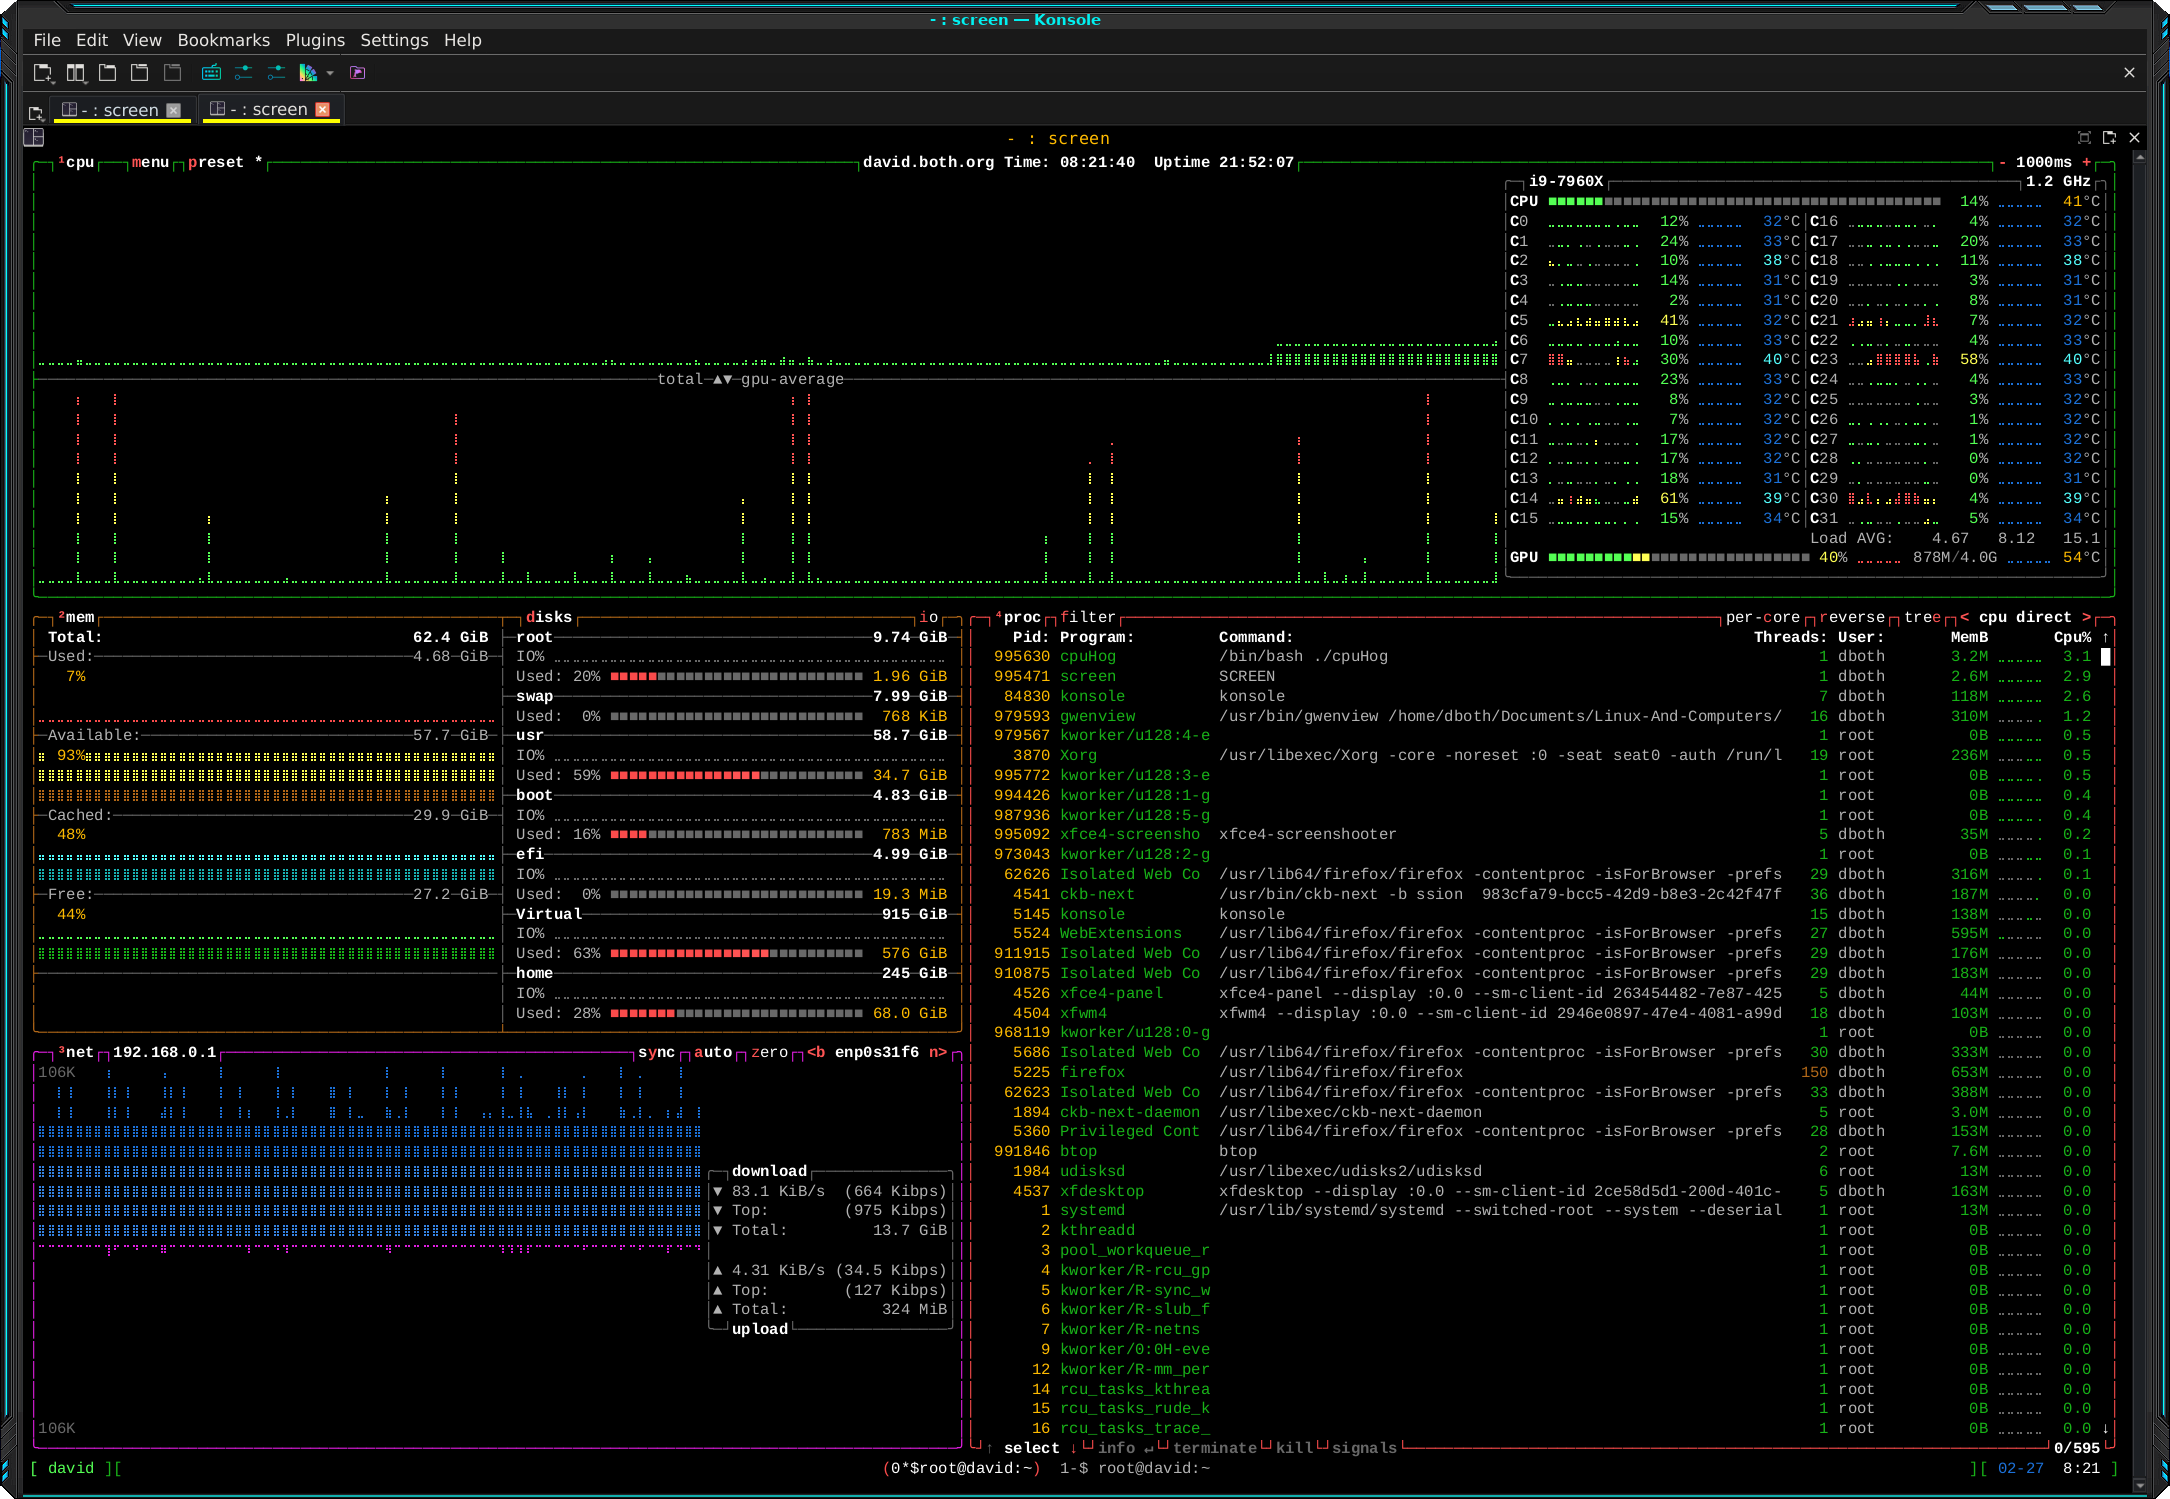
Figure 2. Shows the changes I made to Region 1 as well as a different color them, TTY, which is theme number 2 of 33 different ones. Click the image to enlarge it.
The right side of region 1 shows usage on a per-CPU basis as well as CPU temperatures. The mini-graphs in this section show a very short history of the individual CPU usage, and an even shorter temperature graph. The current CPU usage is shown as a percentage and the current temperature in degrees Celsius. This section also shows the standard load averages, the CPU type, and the current CPU speed.
Region 2 is located on the left side of the display, just below the CPU region. This region displays memory and storage data. The disk section that’s part of this region can be removed and restored using the D key. If any disk activity occurs, it’s shown in the I/O% as a bar graph and in the mount point name line as text indicating the amount in Ki/Mi/GiBytes with an arrow indicating read or write.
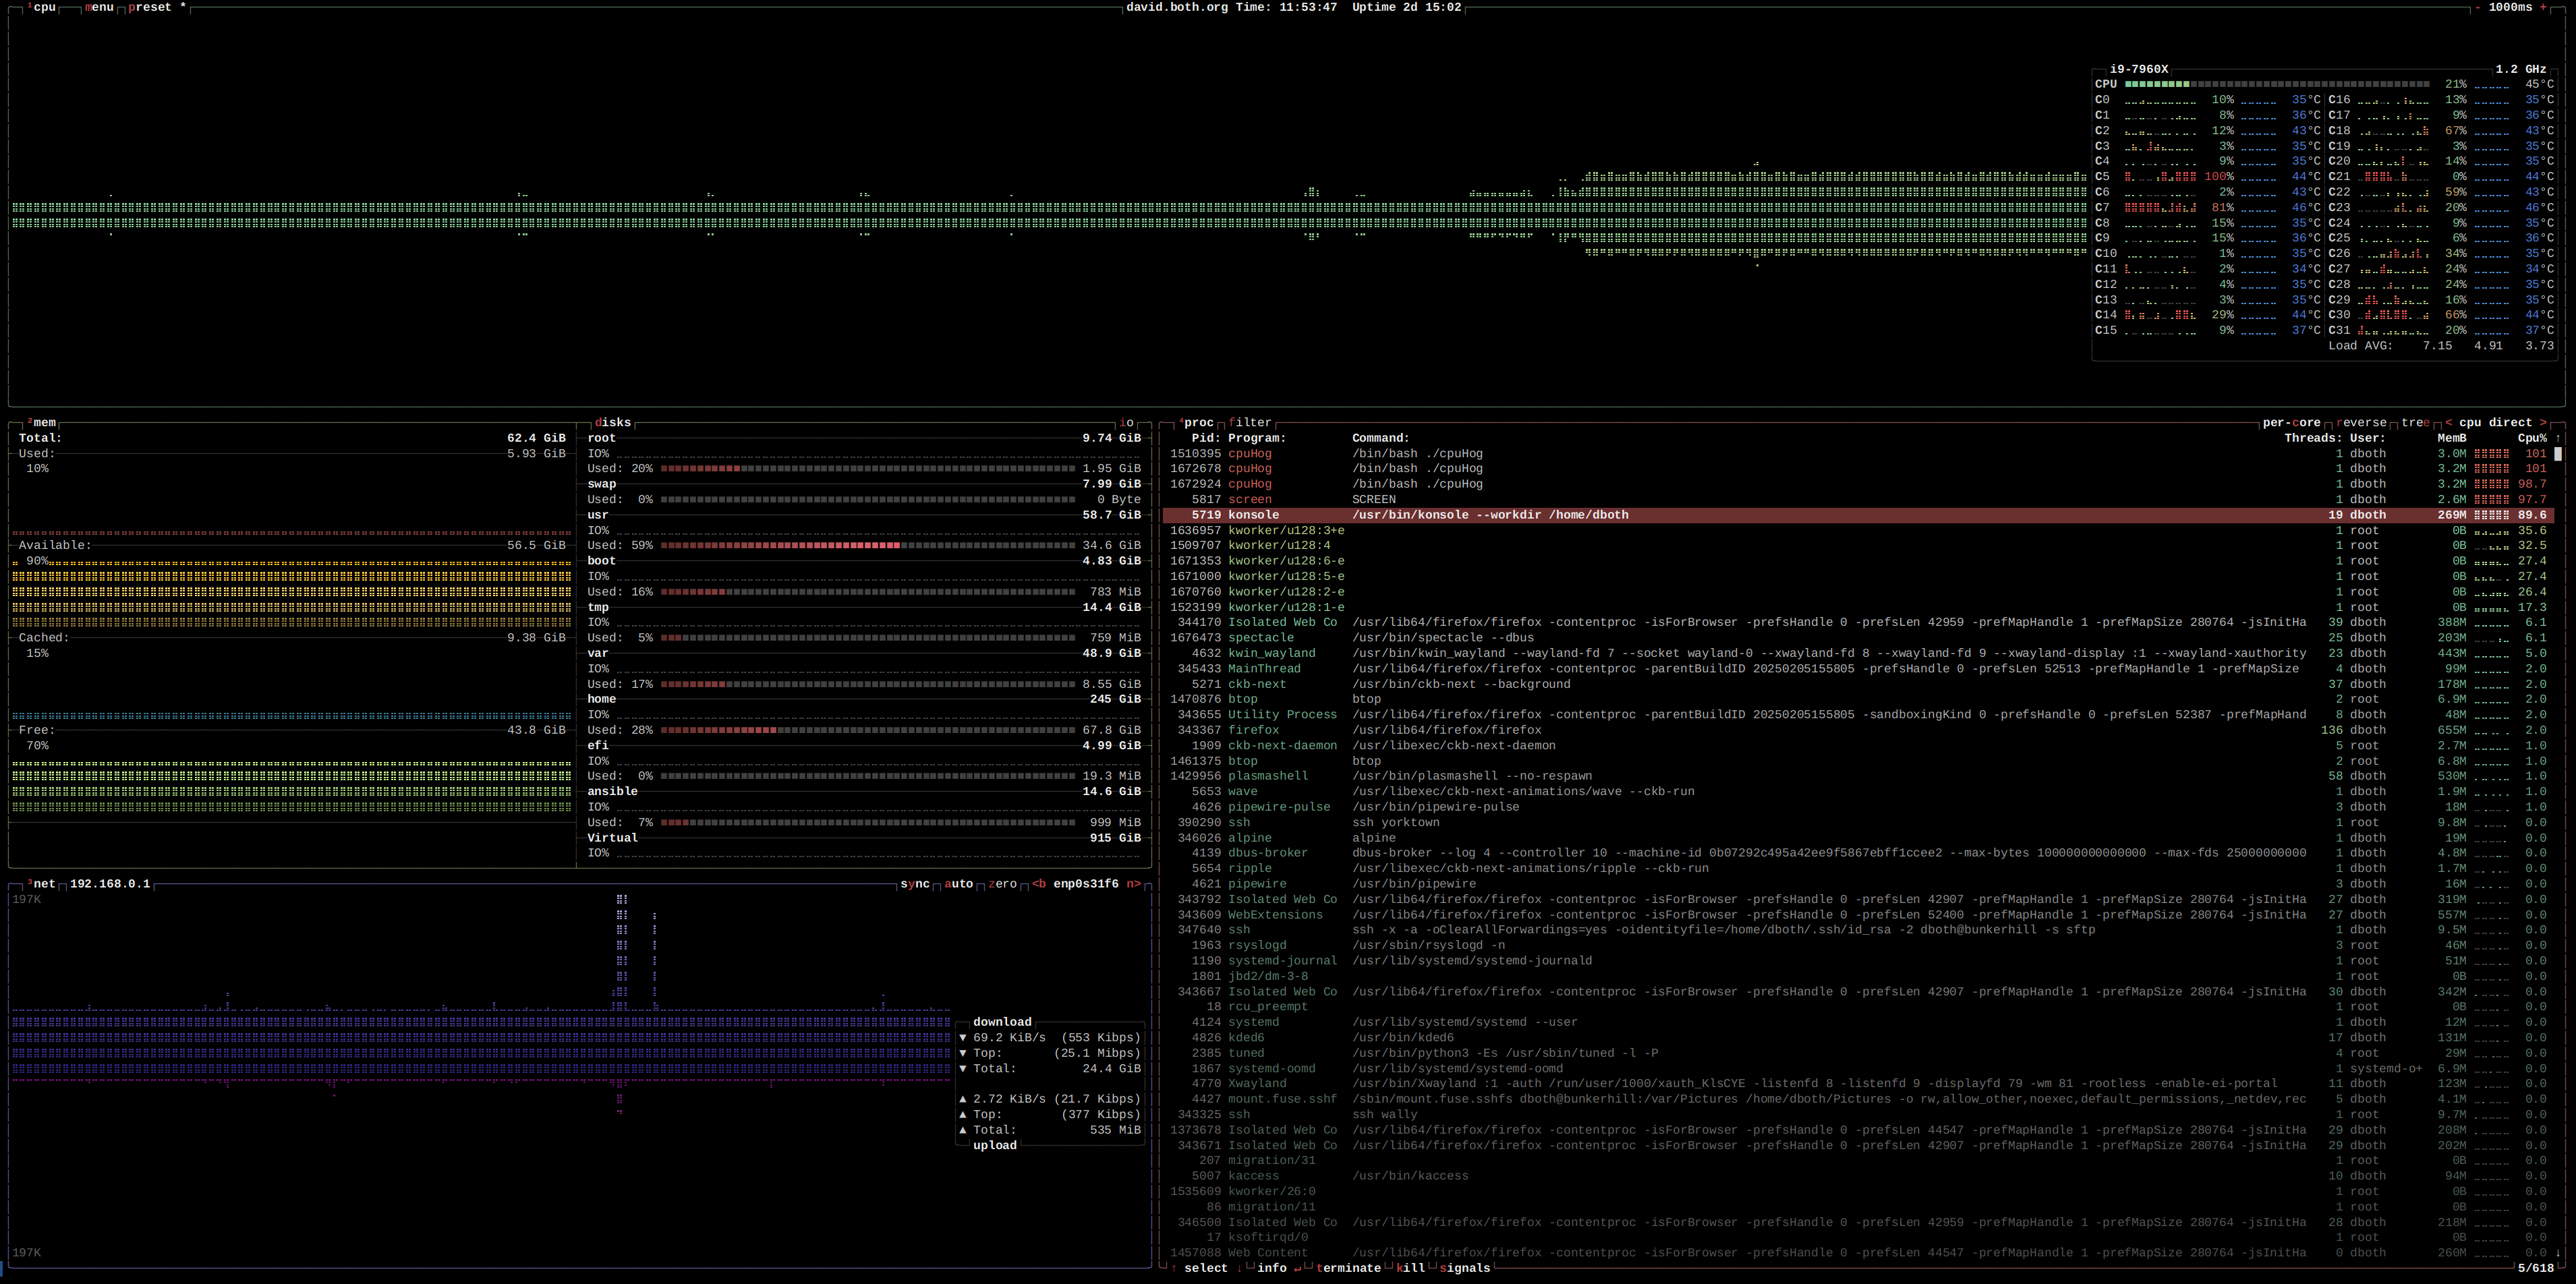
Region 3 contains network performance data, displaying both download and upload statistics in graphical and text formats. If there are multiple network interfaces, you can use the N key to display each in turn. Figure 3 shows btop running on my Linux router and firewall which has three network interface cards NICs. I’ve selected the external NIC to display the activity on my Internet connection. Click on the image to enlarge if for better detail.
Figure 3 also shows the process list in the lower right corner. The process list is region 4. Across the top border there are hints about filtering the process list, sorting, and displaying the list in a tree view. This process list is much the same as all the other top and top-like monitoring tools.
Region 5 is a more detailed view of the GPU status, but it’s not displayed by default. I pressed 5 to display its additional GPU data as seen in Figure 4. This includes a historical vertical bar graph on the left, and an instantaneous horizontal bar graph in the box on the right side of this region. It also displays the name and model of the GPU, the amount of video RAM and how much is used, as well as data flow information.
btop is the only top-like tool I’ve found that provides this much GPU information.
Configuration
All of the configuration necessary for btop can be performed using the built-in menu. Simply press M to get the main menu, then Enter to open the Options menu. Changes made to the running btop instance don’t get written to the configuration file until you quit the program using Q.
The btop configuration files are located in the ~/.config/btop directory. The btop.conf file is a standard Linux configuration file in ASCII text. You can edit this file directly to make changes, but do that only when btop isn’t running or your changes will be overwritten.
For basic help, just press H.
Impressions
Comparing top, htop, and btop for CPU usage with all three running simultaneously, htop uses the most CPU at around 13%, while top and btop vie for first place with 1% to 3% CPU usage. I didn’t even compare Glances directly with the others because it typically uses around 20% CPU time.
Overall, htop provides a great view of all the major functional components of a Linux host. htop makes it all visible in a manner that draws the eye to potential problems. It’s the best high-level view of all these aspects of a running Linux computer I’ve found so far.
I like btop because its text mode interface works on any system with a terminal and doesn’t require a GUI desktop. This makes it, like the other top-like tools, a good choice for systems without a GUI and for remote systems accessible via SSH. It’s excellent use of ASCII graphics makes it ideal in either of those environments even for the Pointy-Haired-Bosses, the PHBs, who like colorful graphs.
I do have one issue with btop. It can be slow to respond to keyboard input. btop is a compiled ELF binary with dynamically linked libraries, so I would expect it to be quite fast. That’s not always the case. It’s response is noticeably slower than that of htop, glances, or top. It’s a bit off-putting, but not enough to stop using it. It seems fine when simply watching it to monitor system activity.
I still use top, htop and glances depending upon my needs of the moment. They all have things that the others don’t, so those features determine the tool best suited for a particular task.
More Stories
Perl and Raku Conference will be held June 27-29, 2025 in Greenville, SC, USA
David Both to be the keynote speaker The Perl and Raku Conference for 2025 is coming up June 27-29, 2025,...
Text fun with Inkscape
Inkscape is one of my favorite open-source graphic design tools. It has an intuitive interface that is relatively easy to...
The Linux Philosophy for SysAdmins, Tenet 17— Use your favorite editor
Author’s note: This article is excerpted in part from chapter 18 of my book, The Linux Philosophy for SysAdmins, with...
What our system maintenance this past weekend says about Linux
I've been thinking a lot about the system maintenance I performed on Saturday, February 22. Prior to that day, I...
Resurrecting a Windows laptop
Recently, a friend gave me a recent model of a Hewlett-Packard Pavilion laptop. He said, “It turns on but goes...