Using htop to manage your Linux system
I use a lot of tools in my daily SysAdmin role. One of the most important ones in my toolkit is htop. The htop program is like top on steroids and offers enhanced capability to view and interact with the running processes. It can be used to view additional system data that top doesn’t provide, so can give a better picture of your Linux system’s functioning.
In this article, we’ll take an in-depth look at htop, it’s configuration, and how to use it.
Preparation
Let’s do a bit of preparation so we’ll have a couple processes to work with. This should be done as a non-root user.
Open a terminal session as a non-root user, and create a file in your home directory. Name it cpuHog and make it executable with the permissions rwxr_xr_x (755). Add the following content to the file.
#!/bin/bash
# This little program is a cpu hog
X=0;while [ 1 ];do echo $X;X=$((X+1));done
Open two more terminal sessions in different windows, position them adjacent to each other so you can watch the results while running htop in the third session. Run the cpuHog program with the following command in two of the three open terminal sessions.
$ ./cpuHogThis program simply counts up by one and prints the current value of X to STDOUT. And it sucks up CPU cycles. The terminal sessions in which cpuHog is running should show very high CPU usage. Observe the effect this has on system performance. CPU usage should immediately go up and the load averages should also start to increase over time. If you want, you can open additional terminal sessions and start the cpuHog program in them so that you have multiple instances running but that’s not necessary for this little experiment.
Getting started
As a non-root user, launch an instance of htop and just observe it for a minute.
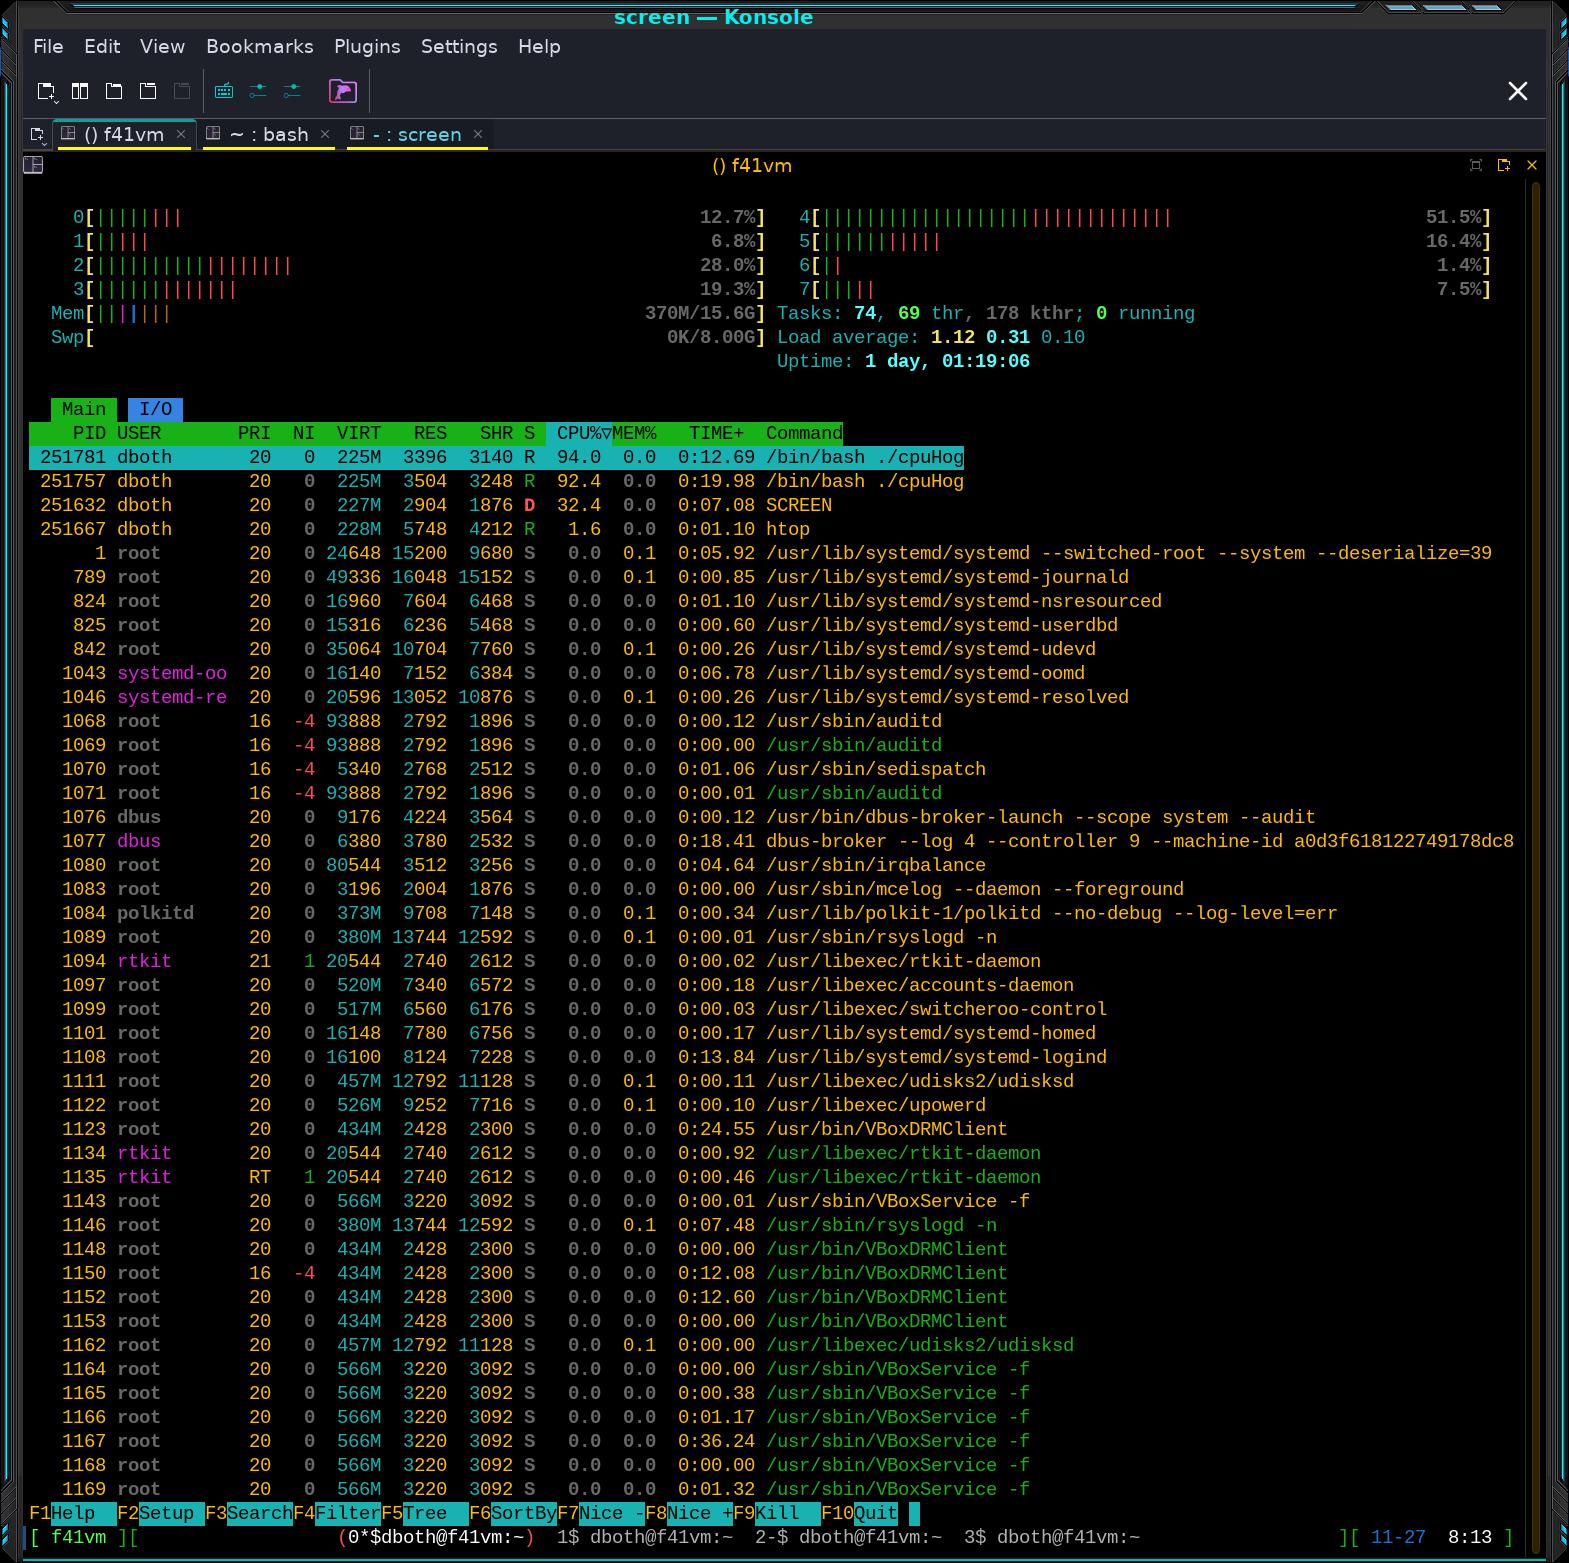
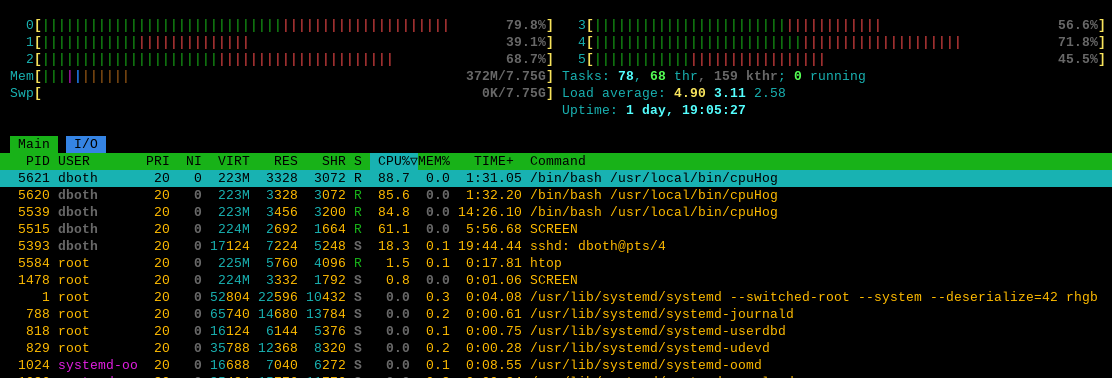
$ htopFigure 1 shows the default configuration for htop, with the two cpuHog instances. There are two sections. The top is the summary section and the bottom section is the process section. More about those shortly. For now we’ll explore how we interact with htop. The colors are a combination of those selected for the terminal emulator and the htop color selections.
Notice the bar graphs and load average data in the summary section. You can see that the data displayed is very similar to top. The function key menu at the bottom of the screen provides easy access to many functions. You can press the H key or F1 to read the short Help page. You should also take a bit of time to read the man page for htop.
It’s possible that, with certain terminal emulators like Konsole and Xfce4-terminal, the F1 (Help) and F10 (Quit) keys don’t work as you would expect in this situation. Instead of performing their designated tasks, the F10 key may open the context window for the terminal emulator. In this event, you’ll need to edit the configuration for the terminal emulator and ensure that the F10 and F1 keys are not used as short-cuts and intercepted by the emulator. It’s easy in some emulators where you only need to open the Edit=>Settings menu. It’s more difficult in Konsole because you need to go to the key bindings and delete any that are defined for those keys.
Most modern Linux computers have a large number of processes so you can use the Page Up and Page Down keys to page through the list of processes.
Use the Up/Down arrow keys to highlight one of the CPU hogs with the cursor ( the black on blue bar on my VM ), then use the F7 and F8 keys to first decrement the nice number to -20 and then increment it to +19, observing both states for a few moments. Watch how the priority of the process changes as the nice number changes.
OK so you can increase the nice number, but Linux — not htop — prevents you from reducing the nice number. This is protection to prevent users from setting a low nice number — less nice — and reducing the CPU cycles available for other users by taking them for your own programs. Only root can reduce the nice number of a process.
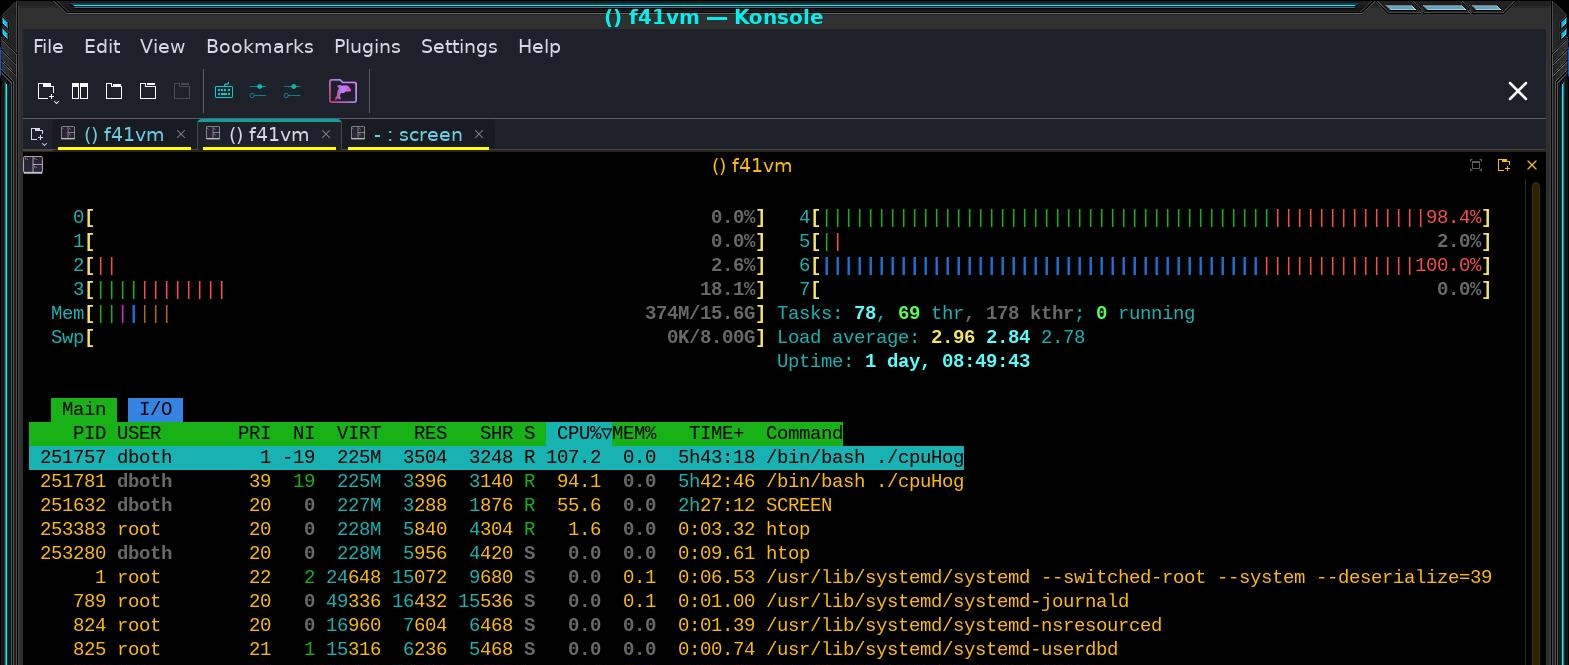
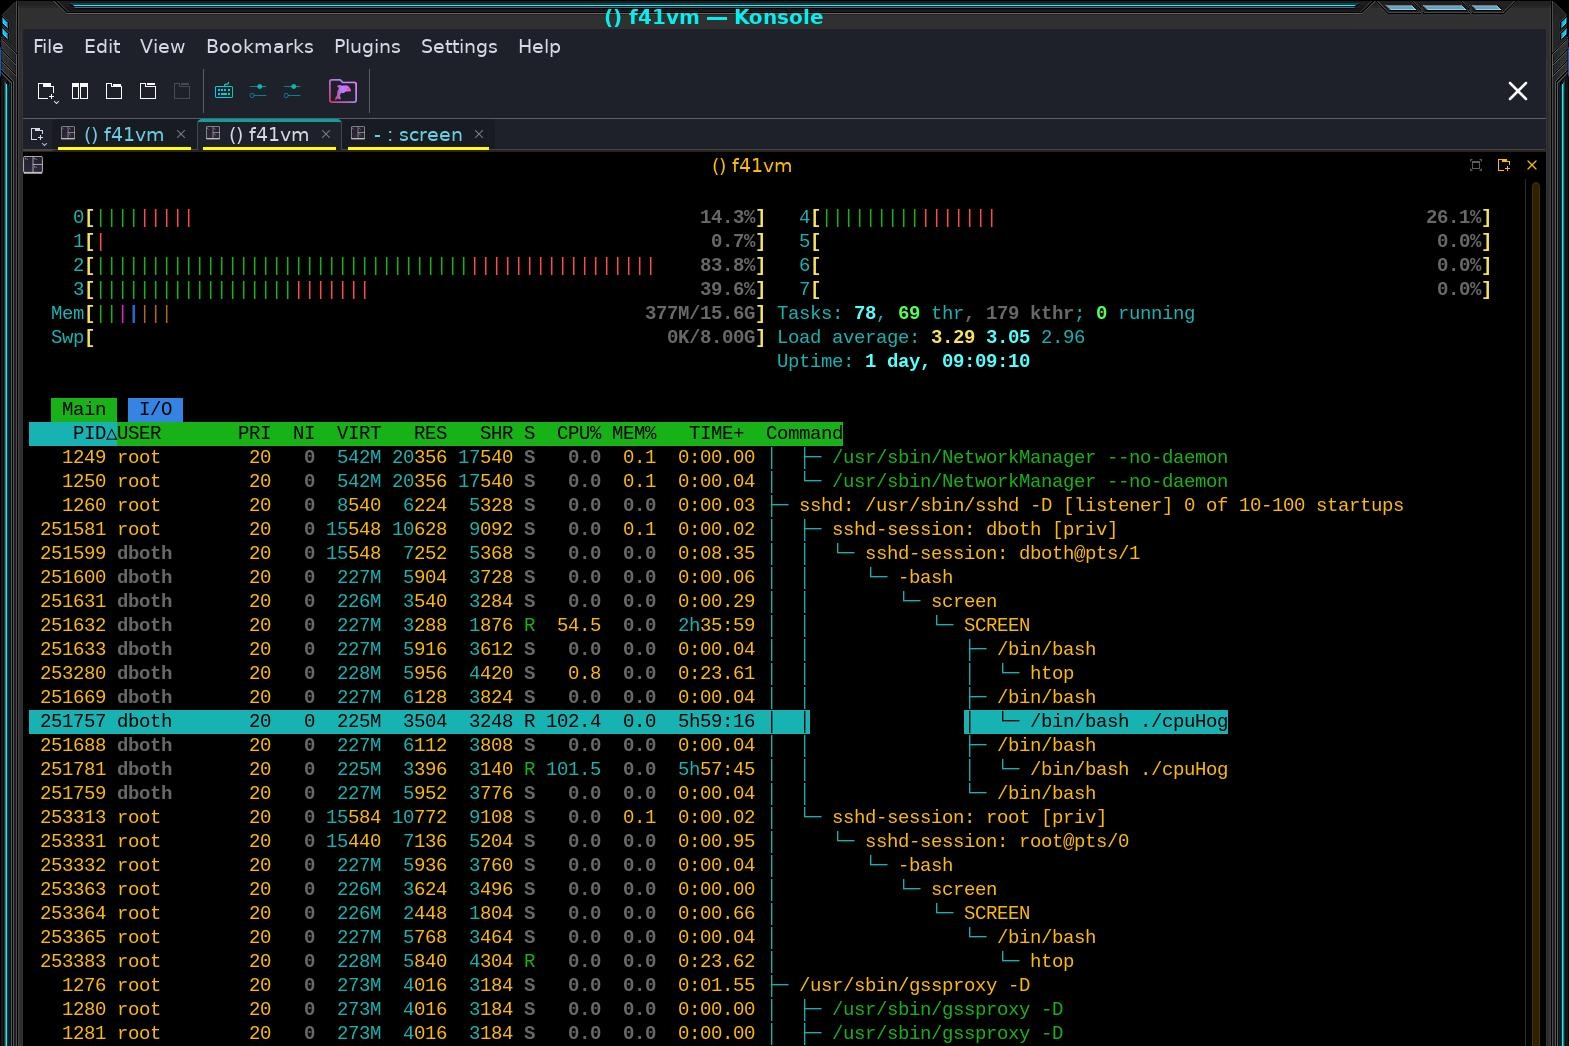
Use a root terminal session and start another htop instance. Now you can reduce the nice numbers of these cpuHogs. First, do as suggested above and use the F7 and F8 keys to first decrement the nice number to -20 and then increment it to +19, observing both states for a few moments. Watch how the priority of the process changes as the nice number changes. You can see in Figure 2, that adjusting the nice numbers of the cpuHogs causes the one with the lowest nice number to use more CPU percentage than the one with the highest nice number.
Continuing as root, highlight first one cpuHog and press the space bar to tag it, then do the same for the second cpuHog. It is OK for the highlight bar to rest on another process while performing this task because only the tagged processes are affected. Use the F7 and F8 keys to adjust the Nice number for these two processes. Assuming that the cpuHogs started with different Nice numbers, what happens when one process reaches the upper or lower limit? I found it very interesting that, when I had one cpuHog nice number set to -19 and the other to 20, the numbers when in opposite directions.
When you’ve done experimenting with this, set both cpuHog instances to a nice number of 0.
You can untag all processes that have been tagged with the u key. Or you could hiughlight them each with the cursor and press the spacebar.
Use the F5 key to display the process tree view. I like this view because it shows the parent/child hierarchy of the running programs. Scroll down the list of processes until you find the CPU hogs. You can do a quick search; press the forward slash (/) and start typing.
Figure 3 shows the cpuHogs in the tree view. You can see that I’ve logged in remotely from a remote host, my primary workstation, using SSH, started a screen session and opened multiple terminals in that session. You can also see a second SSH connection, opened a screen session, and then started htop in that session.
Interpreting the data
Now that we can navigate in htop, let’s look in more detail at the data. There are two main sections to the htop display, the summary section at the top, and the process section on the bottom. Both sections can be customized to meet your needs.
Summary section
The summary section of htop is displayed in two columns by default. It is very flexible and can be configured with several different types of information in pretty much any order you like. Although the CPU usage sections of top and atop can be toggled between a combined display and a display that shows one bar graph for each CPU, htop cannot. But it has a number of different options for the CPU display, including a single combined bar, a bar for each CPU, and various combinations in which specific CPUs can be grouped together into a single bar.
I think this is a cleaner summary display than some of the other system monitors and it is easier to read. The F2 (Setup) key is used to configure the summary section of htop. A list of available data displays is shown. Use the arrow keys to move them to the left or right column and to move them up and down within the selected column.
Process section
The process section of htop is very similar to that of top. Processes can be sorted any of several factors, including CPU or memory usage, user, or PID. Note that sorting is not possible when the tree view is selected. The while [ 1 ] ; do dd if=/dev/sda | od ; done
F6 key allows you to select the sort column; it displays a list of the columns available for sorting and you select the column you want and press the Enter key.
You already seen how to use the up and down arrow keys to select a process. To kill a process, use the up and down arrow keys to select the target process and press the k key. A list of signals to send the process is displayed with 15, SIGTERM, selected. You can specify the signal to use, if different from SIGTERM.
One command key I especially like is F5 which displays the running processes in a tree format making it easy to determine the parent/child relationships of running processes.
htop allows selection of multiple processes so that they can be acted upon simultaneously. It allows you to kill and renice the selected processes and to send signals simultaneously to one or more processes. Use the spacebar to “tag” the processes you want to manage.
I/O tab
I use this little bit of code to read the entire disk to STDOUT so we’ll have something interesting to view.
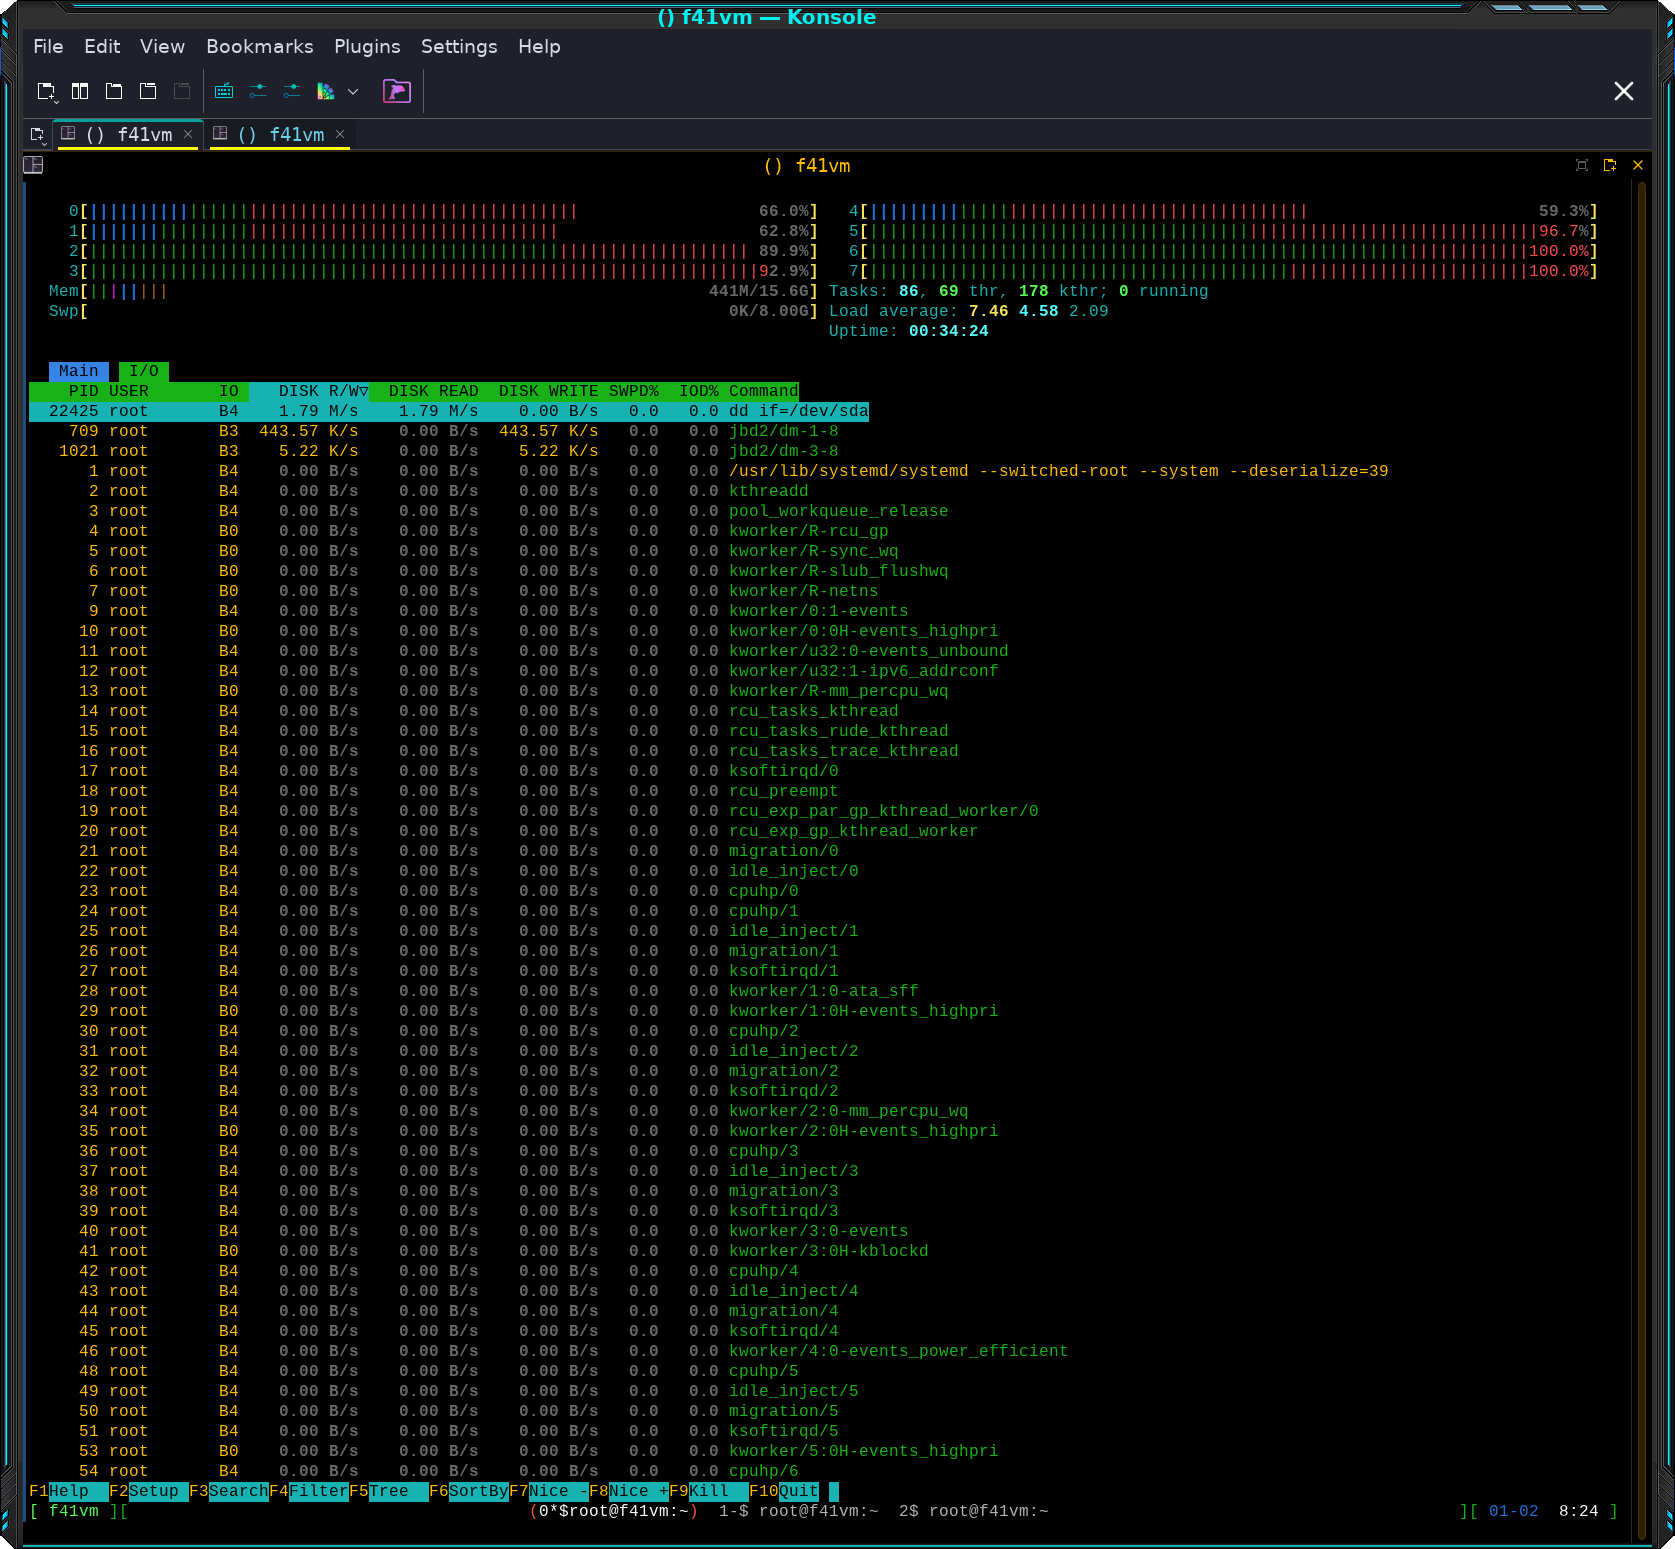
# while [ 1 ] ; do dd if=/dev/sda | od ; doneThe htop program has two tabs, Main, and I/O. Press the TAB key to switch to the I/O tab. Figure 4 shows the I/O tab with some I/O in progress, in addition to the CPU hogs. Click the image to enlarge it.
The I/O tab is sorted by activity, from high to low.The top line shows our little program is reading data at a rate of 1.79MB per Second. The next two lines show the I/O for the physical devices. The acronym jbd means “just a bunch of disks,” the implication being that this is not a multi-device unit such as a RAID array.
Watching this tab can show the most active programs and devices. It allows SysAdmins to determine which programs are producing excessive I/O such as our little demo program.
Configuration
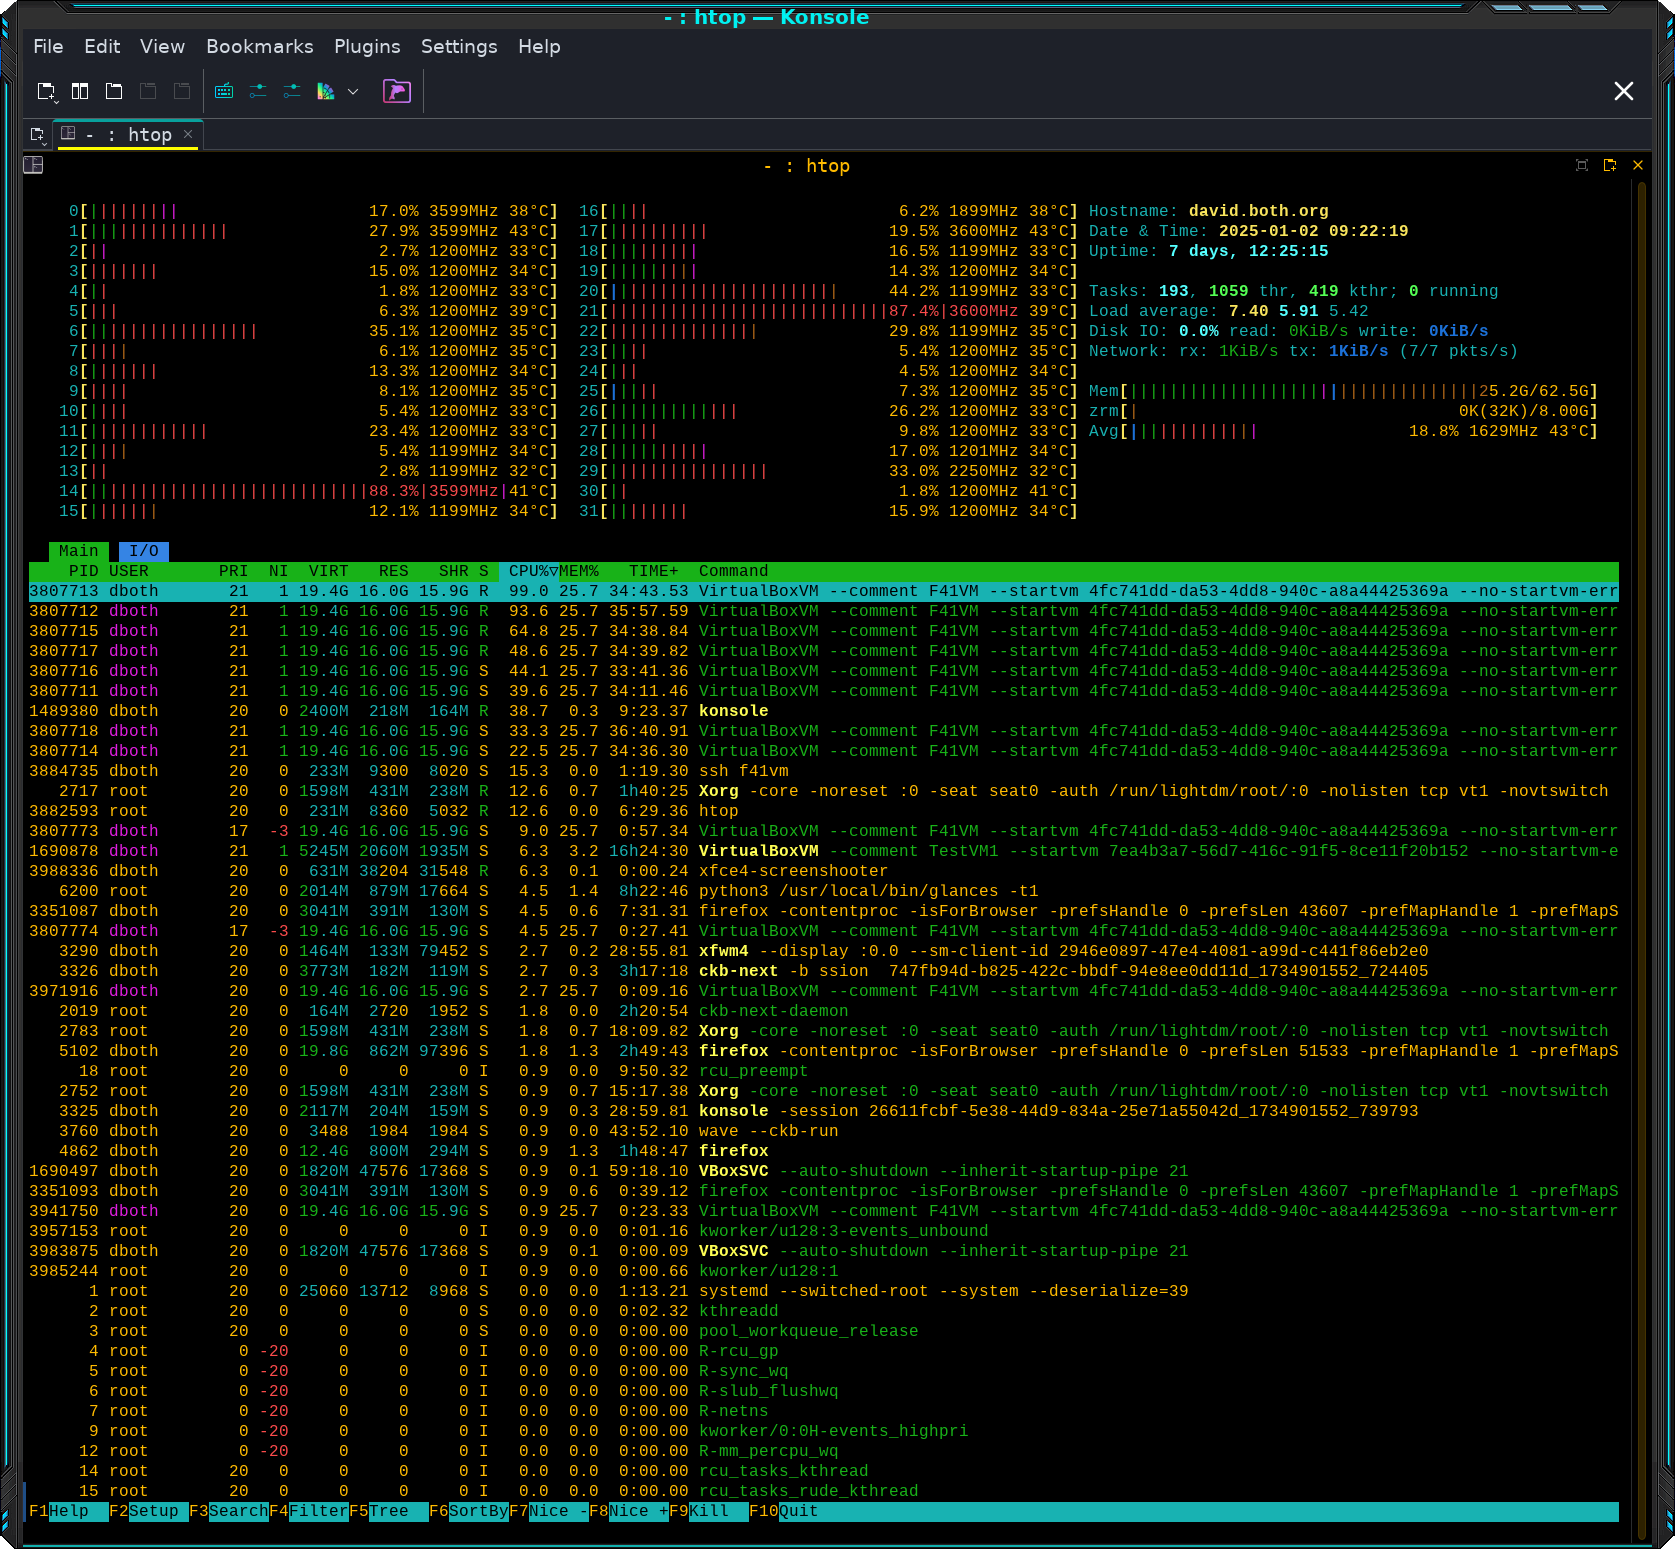
So far we’ve only used the default configuration of htop. I’ve configured it quite extensively to meet my own needs Figure 5 shows htop running on my primary workstation.
Each user has their own configuration file, ~/.config/htop/htoprc and changes to the htop configuration are stored there automatically. The configuration file and its directory don’t exist until the first time htop is run. The directory is created when htop is started for the first time. The htoprc file is created the first time you exit htop.
The global configuration file for htop is /etc/htoprc, but some distros, such as Fedora, don’t create or install one. In this case, hard-coded default options are used the first time htop is used. If no changes to the configuration are made, those defaults are written to the ~/.config/htop/htoprc file.
Press F2 to display the “Setup” menu. In this menu you can modify the layout of the header information and choose some alternative ways to display the data. The Meters menu in the Setup section allows you to select and arrange the meters you want to see in the Summary section. You can also use the space bar to select the meter style such as the default bar graph, text, and large digital display.
Use the F6 key to display the “Sort By” menu and select Time, which shows the total accumulated time for each process. Observe the Time usage data for the two CPU hogs for a few moments. Then revert to sorting by CPU%. The sort column is highlighted.
When finished with any of the configuration menus, press F10 once or Esc twice to return to the normal display.
My thoughts
I find htop to be one of the most useful and effective tools I have. It’s highly configurable while providing a consistent display of important system data. The ability to determine which meters are displayed in the summary section can provide a focused view of one or two specific metrics or a big-picture view that enables the SysAdmin to easily spot anomalous activity.
I strongly suggest that you spend time watching htop when everything is working as expected, so you will be able to identify unusual activity when you see it.
I also think that it’s seldom necessary for SysAdmins to use expensive commercial test suites when performing tests like we’ve done in this article. The power we have at the command line allows us to do almost anything we need to stress-test any Linux host.
Oh, if you’ve left a CPU hog or I/O hog running, terminate it now.
