What are load averages — and what do they mean?
Most system monitoring tools like top, htop, atop, glances, and others display individual processes and information about them. These tools also display three numbers called, “load averages.” But what are load averages and what do they mean?
Load averages are an important criteria for measuring CPU usage and performance. Load average is not the same as CPU usage because it doesn’t include things like I/O wait such as HDD or SSD storage, or network.
But what does this really mean when I say that the 1 (or 5 or 10) minute load average is 4.04, for example?
Load average can be considered a measure of demand for the CPU; they are numbers that represents the average number of instructions waiting for CPU time. So this is a true measure of CPU performance, unlike the standard “CPU percentage” which includes I/O wait times during which the CPU is not really working.
For example, a fully utilized single processor system CPU would have a load average of 1. This means that the CPU is keeping up exactly with the demand; in other words it has perfect utilization. A load average of less than one means that the CPU is underutilized and a load average of greater than 1 means that the CPU is overutilized and that there is pent-up, unsatisfied demand. For example, a load average of 1.5 in a single CPU system indicates that one-third of the CPU instructions are forced to wait to be executed until the one preceding it has completed.
This is also true for multiple processors. If a 4 CPU system has a load average of 4 then it has perfect utilization. If it has a load average of 3.24, for example, then three of its processors are fully utilized and one is utilized at about 24%. In the example above, a 4 CPU system has a 1 minute load average of 4.04 meaning that there is no remaining capacity among the 4 CPUs and a few instructions are forced to wait. A perfectly utilized 4 CPU system would show a load average of 4.00 so that the system in the example is fully loaded but not overloaded.
In Figure 1, all 32 CPUs of my primary workstation are going full blast working on projects for World Community Grid (WCG) which uses BOINC for distributing work units to millions of computers for computation. You can’t see them but it’s also running my email, my Firefox browser with several open tabs, and streaming music from Pandora.
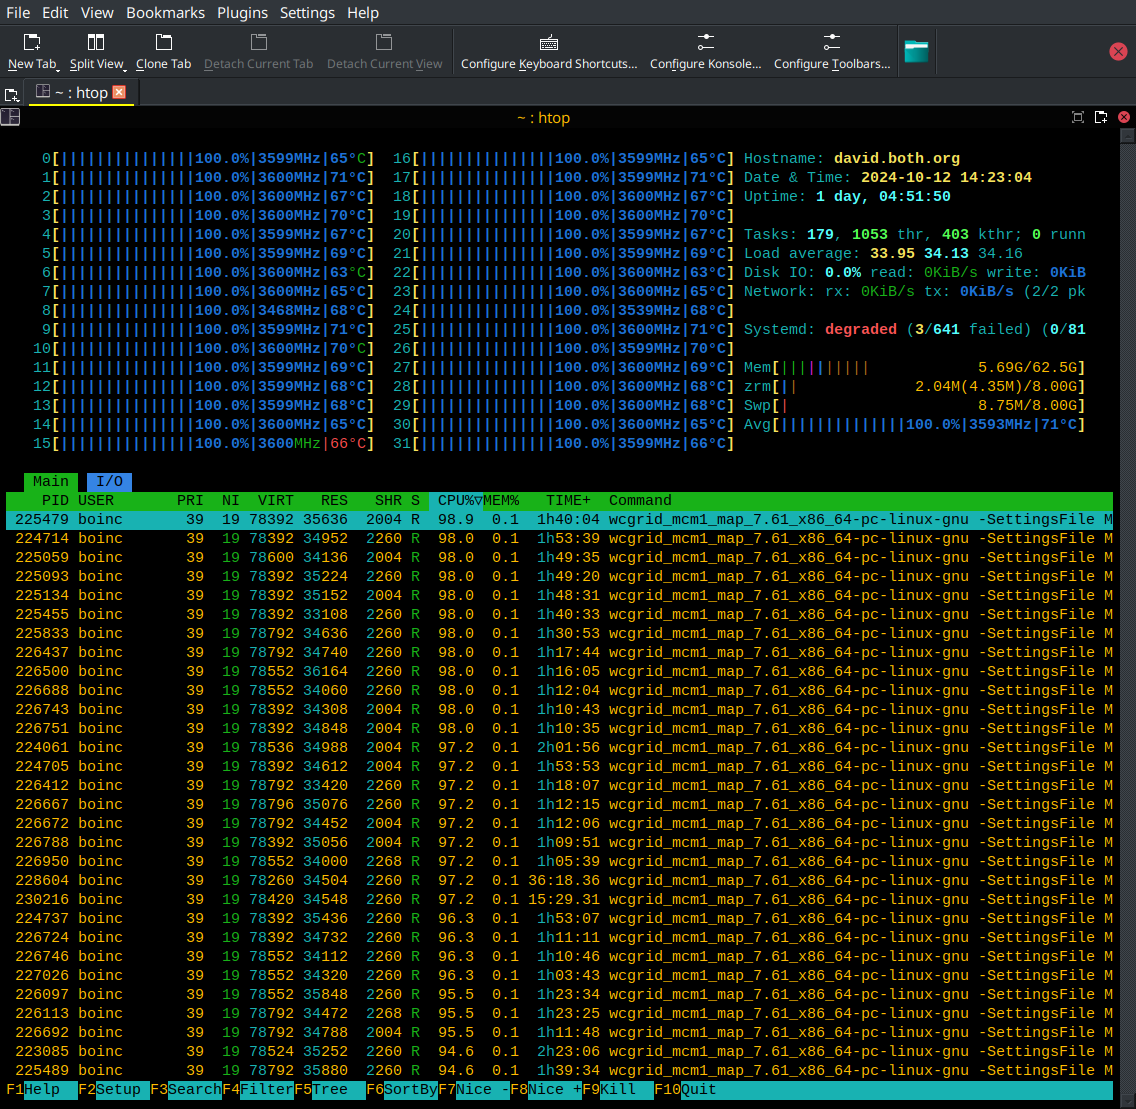
The load averages can be seen on the right side of the summary section at the top of the screen. Those numbers, which I’ve reproduced in Figure 2, are consistent with a system that’s been running with a high CPU load for a long time because they are all slightly greater then the total number of CPUs in the system.
| Interval | Value |
1 | 33.95 |
5 | 34.13 |
15 | 34.16 |
When the load average numbers are greater than the number of CPUs in the system, that usually indicates that some instructions are being queued instead of being executed right away. The optimum condition for load average is for it to equal the total number of CPUs in a system. That would mean that every CPU is fully utilized and yet no instruction must be forced to wait. But reality is messy and optimum conditions are seldom met.
The longer-term load averages provide indication of the overall utilization trend. Figures 1 and 2 show a fairly steady load over the three time-spans.
I stopped the WCG computations and captured the results after a couple minutes. Figure 3 shows the load averages decreasing most rapidly for the 1 minute interval and most slowly for the 15 minute interval. You’ll also notice that memory usage has gone down from Figure 1 to Figure 3.
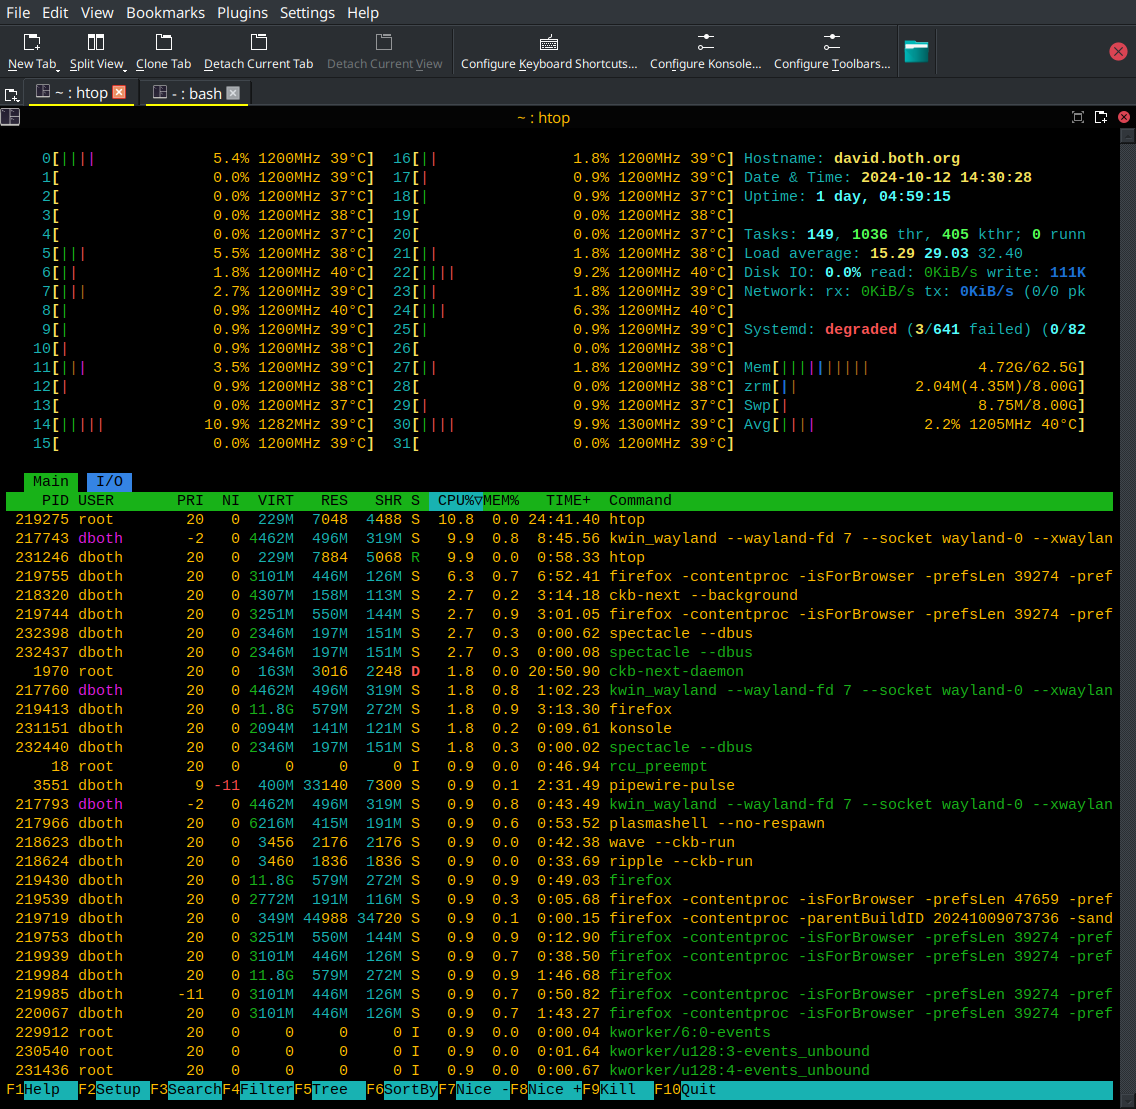
I’ve reproduced the load average numbers from Figure 3, here in Figure 4 for clarity.
| Interval | Value |
1 | 15.29 |
5 | 29.03 |
15 | 32.40 |
One of the first things I check when looking for performance issues is the load average. That doesn’t tell me what the specific root cause is, but it does tell me that there is a performance problem. Of course, if you’re like me and keep your CPUs going full blast, you can still tell if there’s a problem. I just need to stop the processes that I know take up a lot of CPU time. This is one good reason to use your tools to monitor the system when things are working as they should; so you’ll know what it’s supposed to look like.
Resources
Linux Journal has an excellent article describing load averages, the theory, the math behind them, and how to interpret them in the December, 2006 issue. Linux Journal, Examining Load Average, http://www.linuxjournal.com/article/9001?page=0,0. This article is still available on-line as of October 2024.
More Stories
Open Source on macOS: Exploring Free Software on My M3 MacBook
Lead Image by Tom's Hardware Guide Open-source software is not restricted to Linux. While I spend most of my time...
Call for articles — Switching to Linux
October 25 is the last day of support for Win10 and over 400 million PCs can't upgrade to Win11. I...
Moving from Windows 10 to Linux
Instead of purchasing a new computer just to run a new version of Windows, consider installing Linux.
The Linux Philosophy for SysAdmins, Tenet 18—Document everything
“Real programmers don’t comment their code, if it was hard to write, it should be hard to understand and harder to modify.”
— unknown
Signal Messenger: Privacy, Simplified with Open Source
Messaging apps have revolutionized communication, reshaping our daily lives and relationships. It’s hard to imagine a time without SMS paving...
Connect to a Windows drive from Linux
Here’s how I connected my Linux system to a Windows AD fileshare.