I found a new way to stress-test my Linux hosts
I just discovered an important little program that allows me to stress-test my Linux hosts. Its name is — stress — of course. Stress has been around for some time, and this is a resurrection of a previous version, though I can’t find any information about that earlier one. This incarnation is about three years old and is currently on release 1.0.7. But it’s new to me as I just discovered it today.
I installed stress directly from the Fedora repository.
# dnf -y install stressStress may be available from the repository for your distro, but it’s also available from GitHub at https://github.com/resurrecting-open-source-projects/stress.
I read the concise manual page and discovered that stress can test CPU, memory, raw I/O, and disk I/O. Stress has a lot of flexibility; SysAdmins can specify any one or multiple resources to test, and how many worker threads to use. It can run forever or we can specify a timeout.
Check the base state
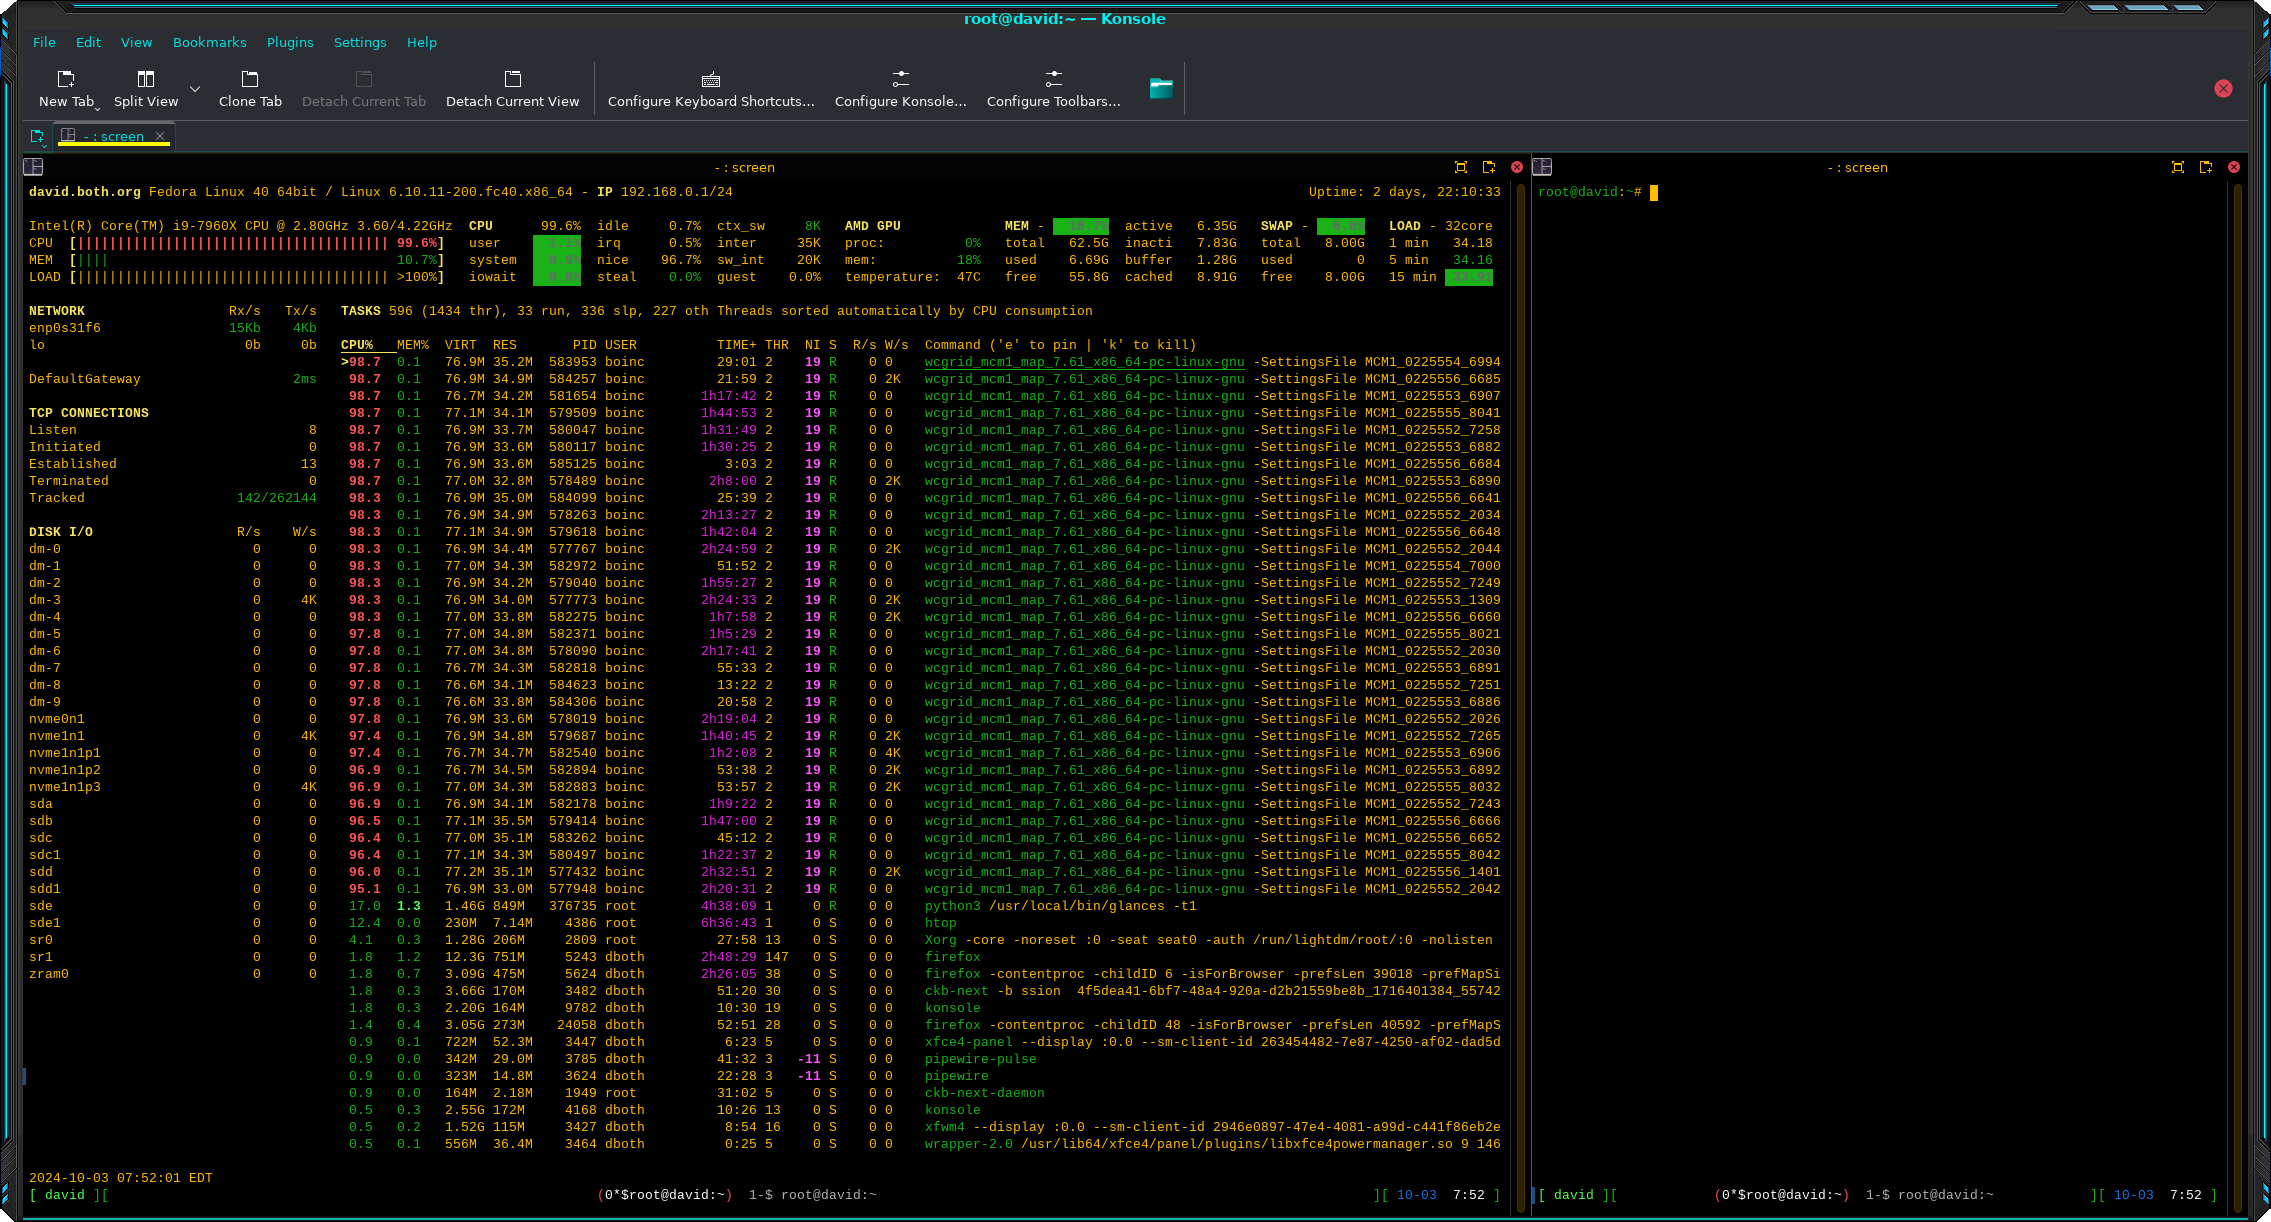
Let’s start with a look at my primary workstation’s base state in Figure 1 before running any stressors. I do run BOINC most of the time to perform calculations for World Community Grid. That takes a lot of CPU, some memory, and some disk I/O. So we’ll be looking at the effects that stress has on my system even while running a non-related, significant load.
I’ve split my Konsole session into two side-by-side terminals and moved the divider to maximize the left side terminal that’s running glances, a powerful and flexible system monitoring tool. The terminal session on the right side is where I enter the commands and it doesn’t need to be very wide.

Be sure to click on the images in this article to enlarge them for additional detail.
CPU
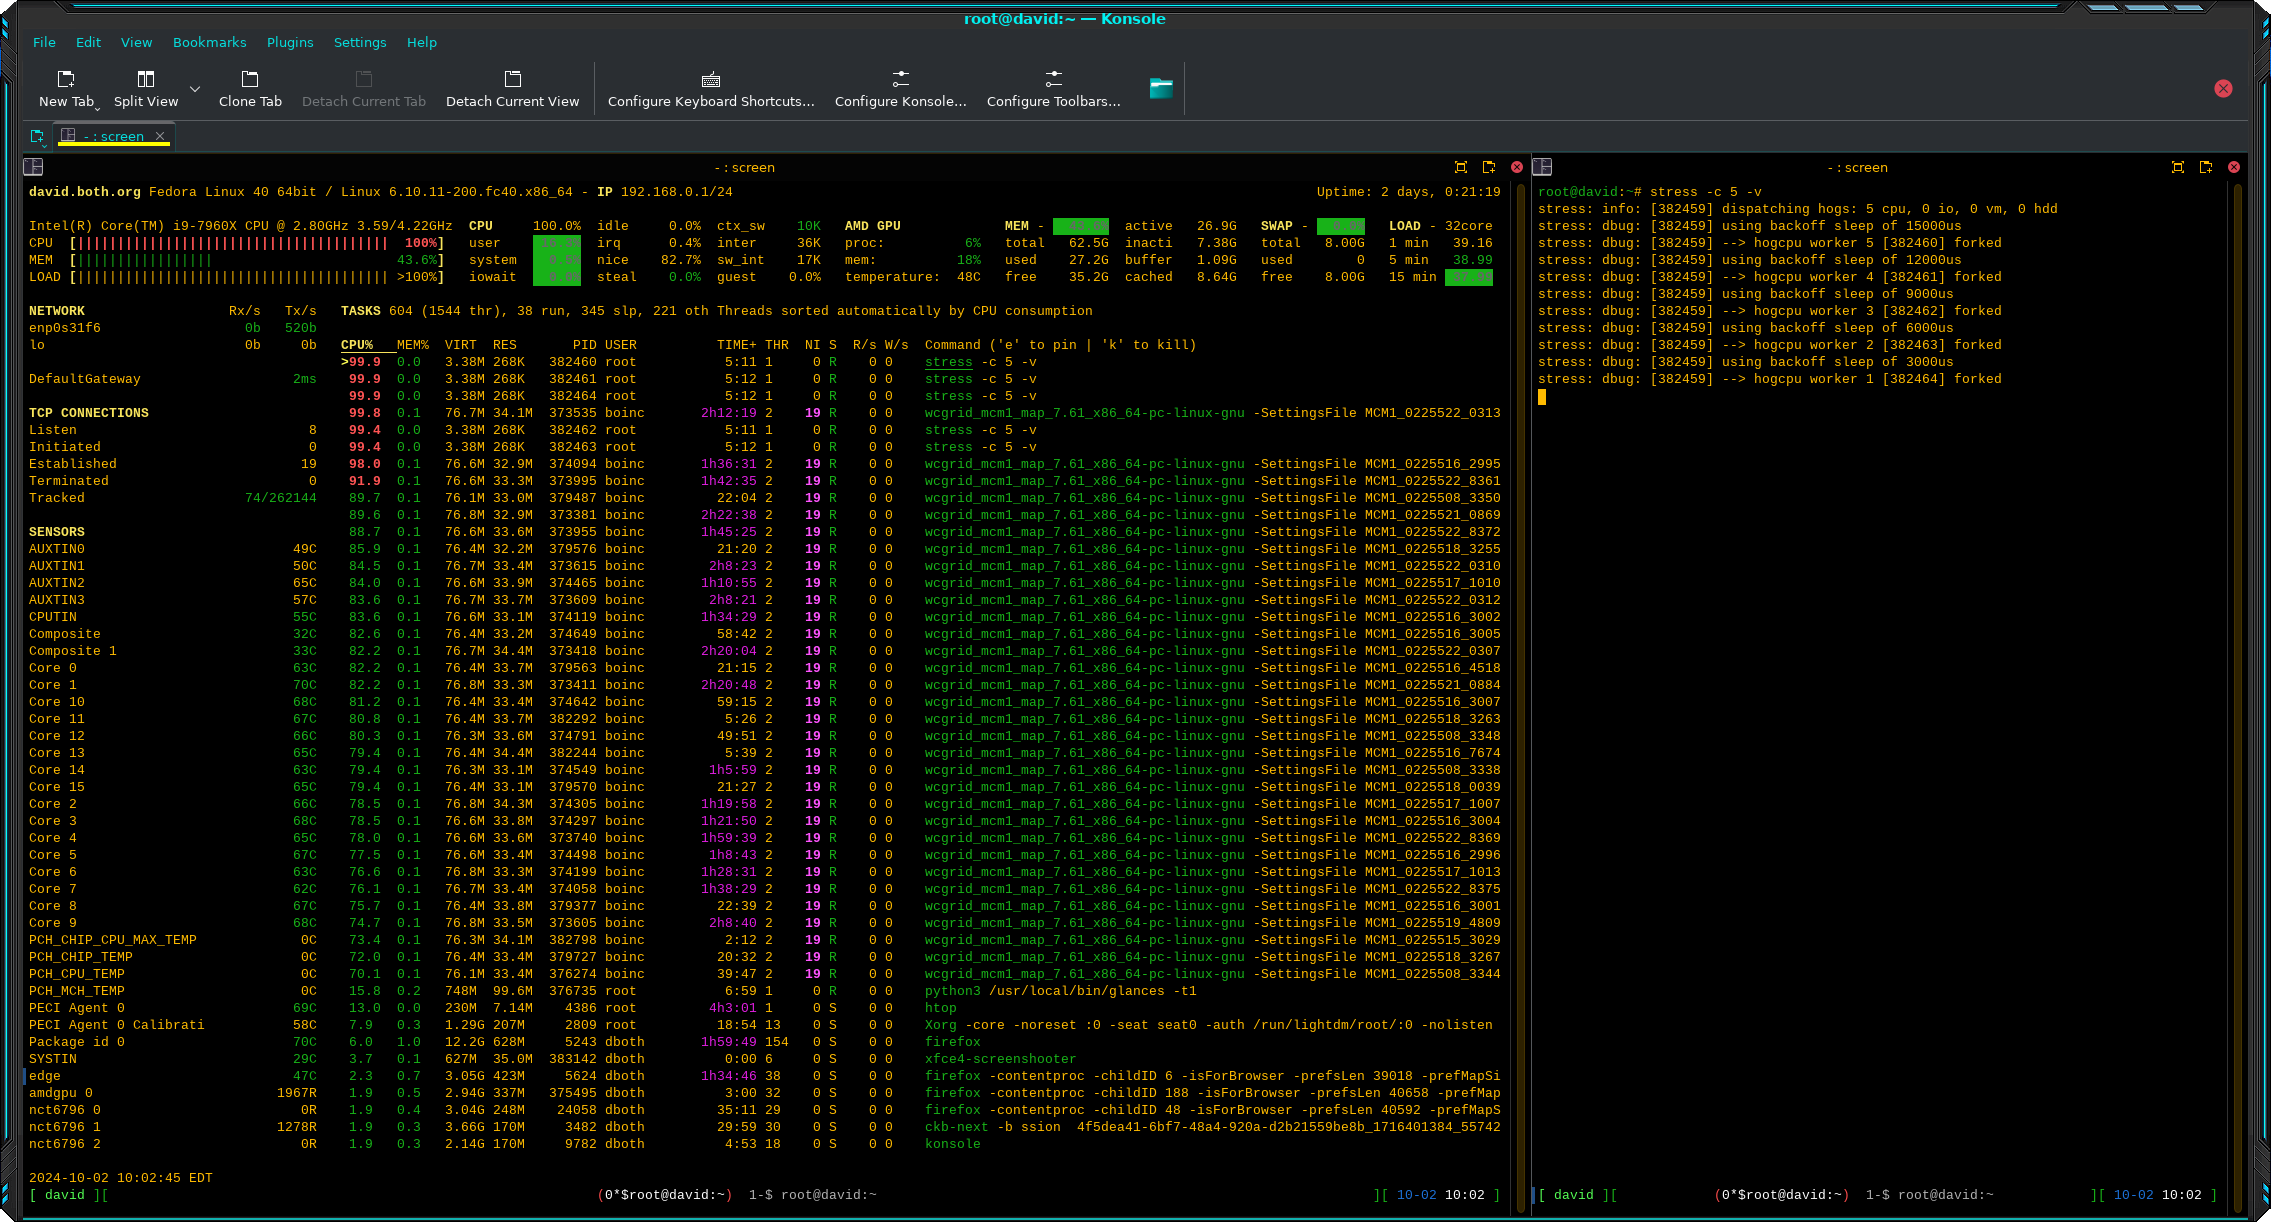
I used a simple command to begin checking CPU stress. In this case I configured only five worker threads ( -c 5 ), since I had no idea what this would look like or how it would affect my system overall. I also set the verbose flag ( -v ) so I could see some details about what stress was doing.
root@david:~# stress -c 5 -v
stress: info: [382459] dispatching hogs: 5 cpu, 0 io, 0 vm, 0 hdd
stress: dbug: [382459] using backoff sleep of 15000us
stress: dbug: [382459] --> hogcpu worker 5 [382460] forked
stress: dbug: [382459] using backoff sleep of 12000us
stress: dbug: [382459] --> hogcpu worker 4 [382461] forked
stress: dbug: [382459] using backoff sleep of 9000us
stress: dbug: [382459] --> hogcpu worker 3 [382462] forked
stress: dbug: [382459] using backoff sleep of 6000us
stress: dbug: [382459] --> hogcpu worker 2 [382463] forked
stress: dbug: [382459] using backoff sleep of 3000us
stress: dbug: [382459] --> hogcpu worker 1 [382464] forked
You can see the result in Figure 2. The CPU hogs can be seen near the top of the list of running programs. Of course the total CPU usage hasn’t changed.

Notice that the World Community Grid (WCG) threads have a nice number of 19, while the CPU worker threads have a nice number of 0, so they take precedence. I spent some time experimenting with larger numbers of workers, 50 was the most, and eventually the WCG threads were getting smaller amounts of CPU time, but still around 50% per thread. I noticed very little effect on my other use such as working with email, writing this article, and using Screenshot to capture these images.
Since I hadn’t set a time limit, I used Ctrl+C to terminate stress.
Memory
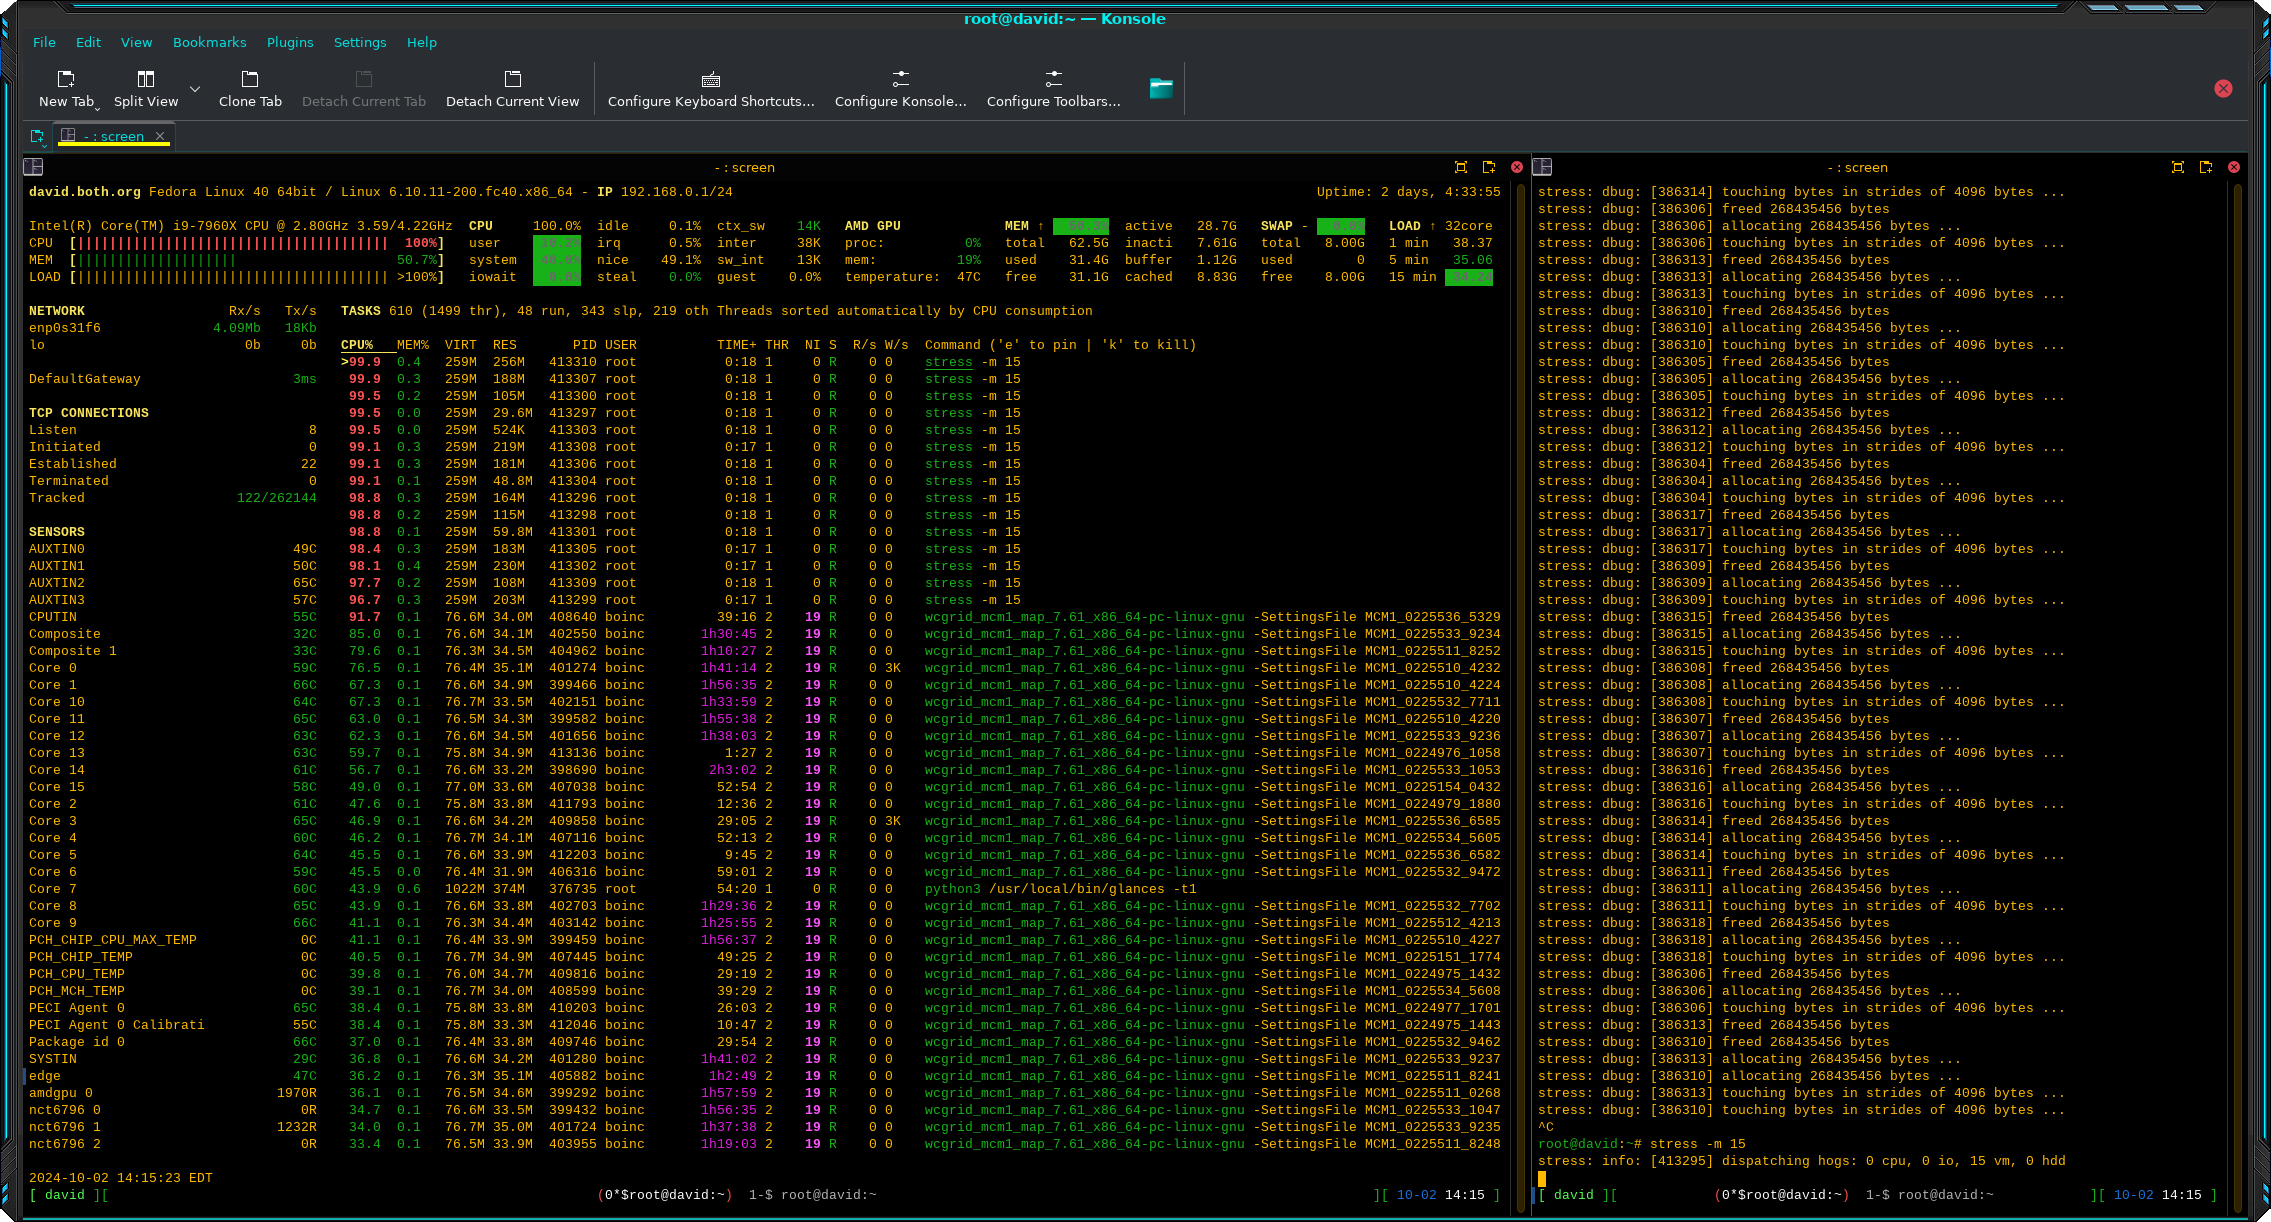
The next thing I tried was stressing RAM. These workers touch otherwise unused RAM to cause it to be allocated in blocks of 268,435,456 bytes, and then they release that memory.
# stress -m 15Figure 3 shows the effects of memory stress. You can see that some additional memory has been allocated over the baseline in Figure 1. More workers would cause more memory to be allocated.
I tried different numbers of memory worker threads. The most I tried was 75 workers which results in about 65% memory usage. Once again I noticed no significant impact on my normal tasks.
Disk I/O and raw I/O
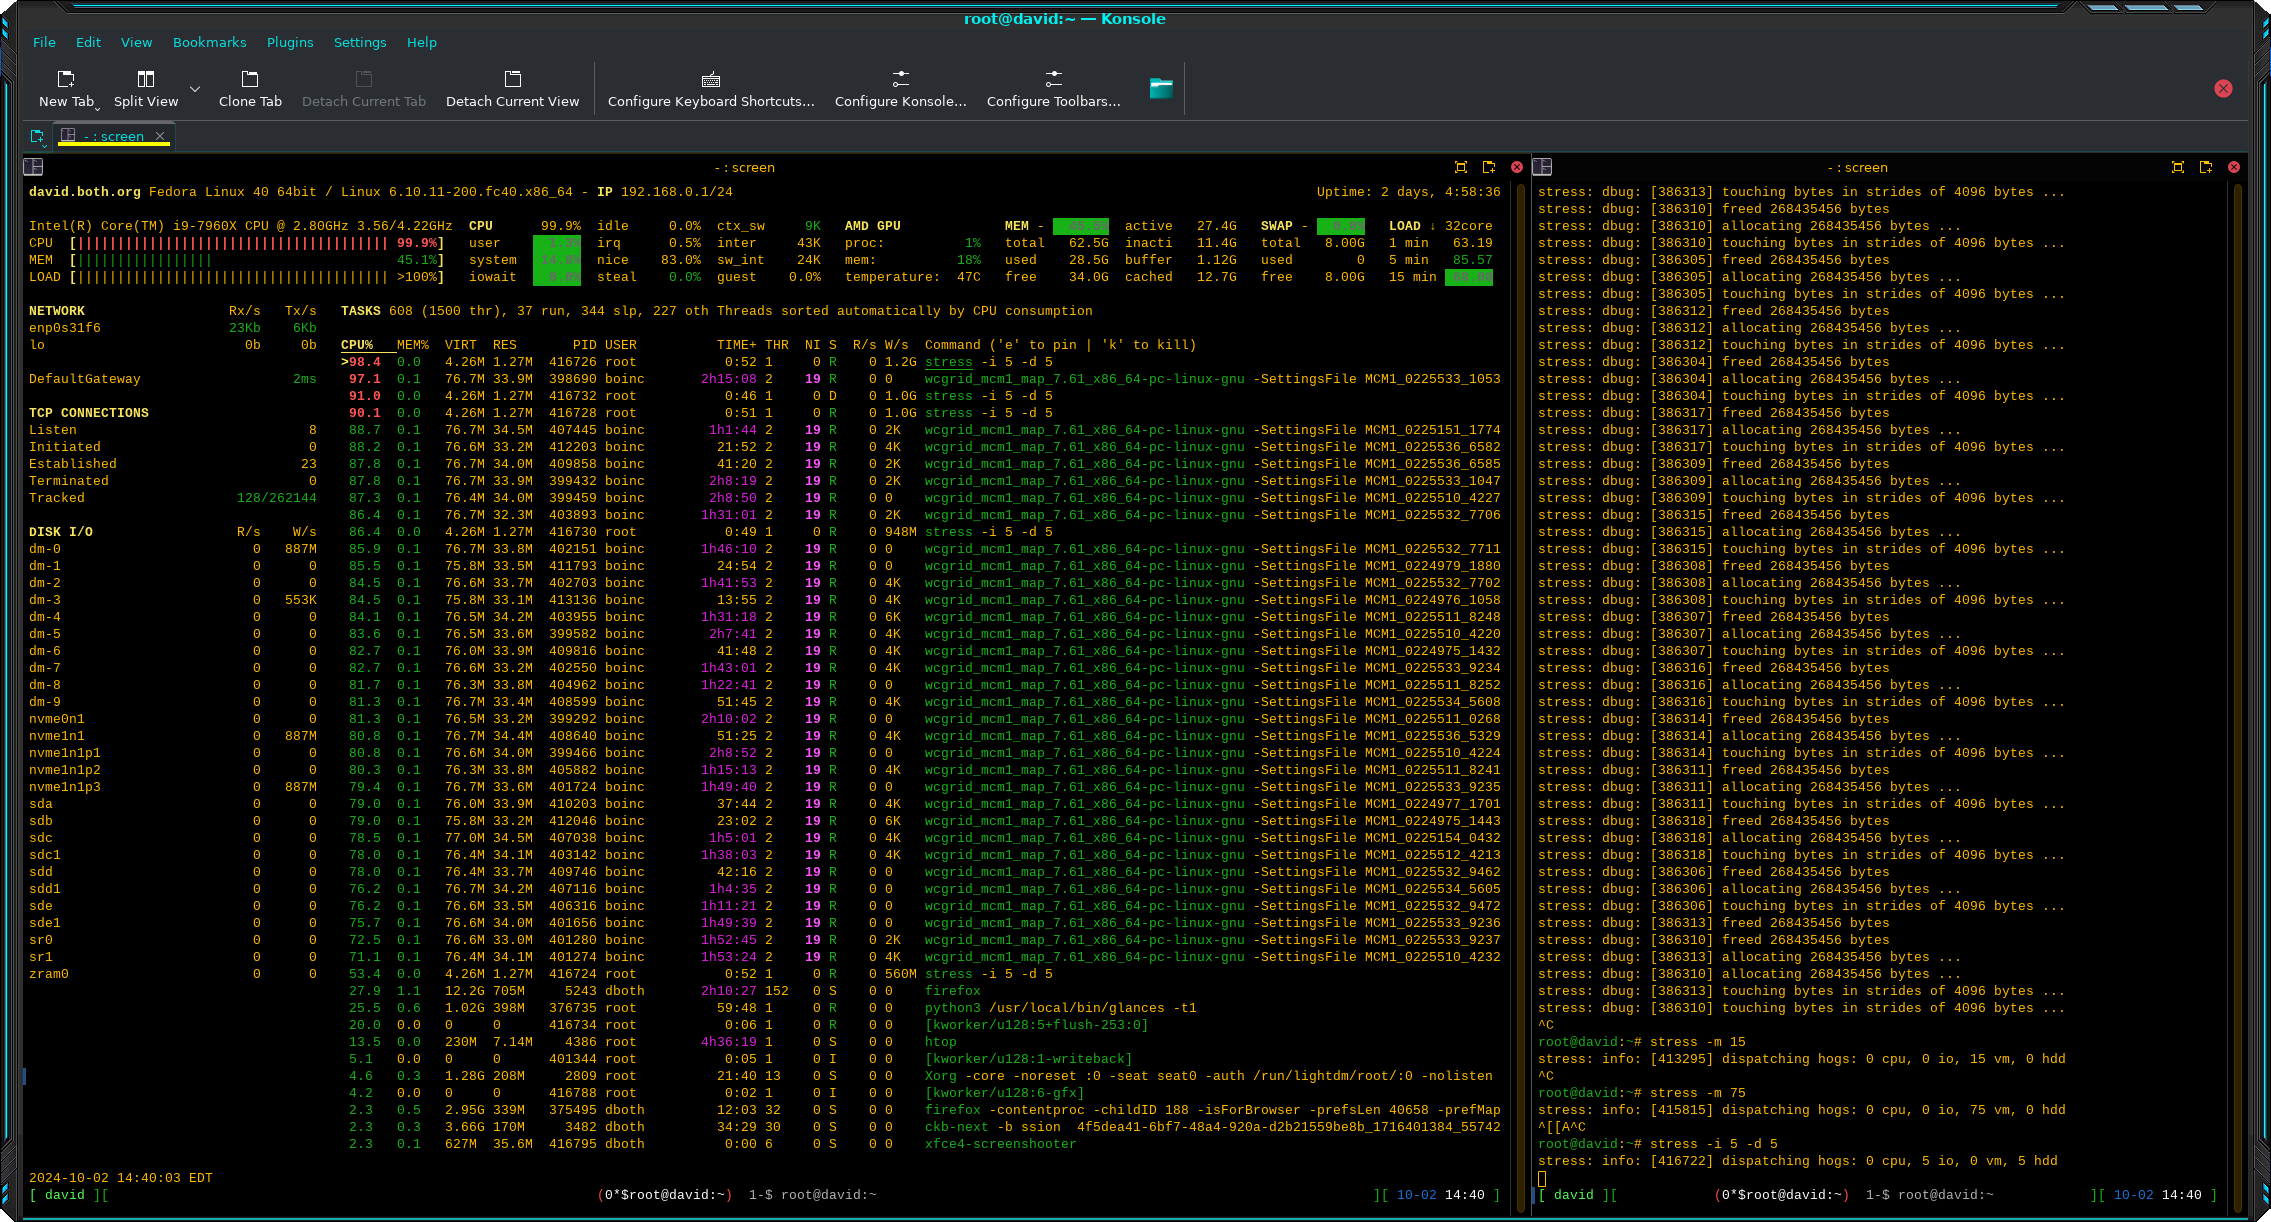
I did disk I/O and raw I/O simultaneously to see how that would work. Like the others, I used only a few worker threads for this test to begin.
# stress -i 5 -d 5Figure 4 shows the effects that this has on I/O. The disk I/O section in the left sidebar shows large data writes to multiple devices while the process section shows the I/O activity for the individual worker processes.
I found that using htop instead of glances to monitor I/O gives a different, and I think more concise picture of I/O, especially on the I/O tab and the Disk I/O line in the summary section, if you’ve added that to the view. It’s not different information, it’s just presented in a different manner.
Using each of these options separately, I was able to see that DIsk I/O and raw I/O both use disk I/O as their stressors. It does seem that they work a bit differently and produce a somewhat different result. Nevertheless it’s essentially the same test. Not that there’s any other device commonly used on most computers that could be used to test I/O.
Once again, I experienced no noticeable impact on the responsiveness of my system when performing normal activities.
However, I also discovered that in around a couple hours — on a different host — the disk filled up when testing disk I/O. This produced errors in the terminal in which I ran the program. In Figure 5 you can see that I was testing all four stressors with 20 worker threads each.
# stress -d 20 -m 20 -c 20 -i 20 -t 7200
stress: info: [536717] dispatching hogs: 20 cpu, 20 io, 20 vm, 20 hdd
stress: FAIL: [536777] (599) stress: FAIL: [536797] (599) write failed: No space left on device
write failed: No space left on device
stress: FAIL: [536749] (599) write failed: No space left on device
stress: FAIL: [536781] (599) write failed: No space left on device
stress: FAIL: [536769] (599) write failed: No space left on device
stress: FAIL: [536785] (599) write failed: No space left on device
stress: FAIL: [536721] (599) stress: FAIL: [536753] (599) write failed: No space left on device
write failed: No space left on device
stress: FAIL: [536745] (599) stress: FAIL: [536729] (599) write failed: No space left on device
write failed: No space left on device
stress: FAIL: [536737] (599) write failed: No space left on device
stress: FAIL: [536765] (599) write failed: No space left on device
stress: FAIL: [536725] (599) write failed: No space left on device
<SNIP>
Figure 5: Stress did fill up the filesystem on another host when testing disk and raw I/O.
The space on the filesystem was de-allocated when stress completed the full two hours.
Summary
Stress is a cool but basic tool that allows stress-testing of memory, CPU, disk, and raw I/O. It doesn’t currently provide tests for GPU, display, or network. While that can be limiting in some environments, it provides solid stressors for the big four that affect everyone.
There’s a lot of interesting information to be had from the stress tool. I find it interesting to watch as the hogs ramp up very quickly and then as the effects drop down when the program is terminated. CPU and I/O drops off as soon as the hogs terminate. Memory is de-allocated and returned to the memory pool much more slowly. This provides some insight into how the kernel manages memory, while suggesting some lines for additional testing. For example, does de-allocation occur faster in low memory environments?
Activity for other tests drops off directly as the workers are terminated. This can take a few seconds — more if you’ve started a large number of worker threads.
I’ve added stress to my toolkit for testing newly built or rebuilt systems.
The stress project is looking for programmers to help with development. Apply at https://github.com/resurrecting-open-source-projects/stress.

