
How many usability testers do you need?
When you start a usability test, the first question you may ask is “how many testers do I need?” The standard go-to article on this is Nielsen’s “Why You Only Need to Test with 5 Users” which gives the answer right there in the title: you need five testers.
But it’s important to understand why Nielsen picks five as the magic number. MeasuringU has a good explanation, but I think I can provide my own.
Overlap in finding issues
The core assumption is that each tester will uncover a certain amount of issues in a usability test, assuming good test design and well-crafted scenario tasks. The next tester will uncover about the same amount of usability issues, but not exactly the same issues. So there’s some overlap, and some new issues too.
If you’ve done usability testing before, you’ve observed this yourself. Some testers will find certain issues, other testers will find different issues. There’s overlap, but each tester is on their own journey of discovery.
How many usability issues one person can find is up for some debate. Nielsen uses his own research and asserts that a single tester can uncover about 31% of the usability issues. Again, that assumes good test design and scenario tasks. So one tester finds 31% of the issues, the next tester finds 31% but not the same 31%, and so on. With each tester, there’s some overlap, but you discover some new issues too.
The math behind the number
In his article, Nielsen describes a function to demonstrate the number of usability issues found versus the number of testers in your test. For a traditional formal usability test, this function is:
1 – (1-L)n
…where L is the amount of issues one tester can uncover (Nielsen assumes L=31%) and n is the number of testers.
I encourage you to run the numbers here. A simple spreadsheet will help you see how the value changes for increasing numbers of testers. What you’ll find is a curve that grows quickly then slowly approaches 100%.
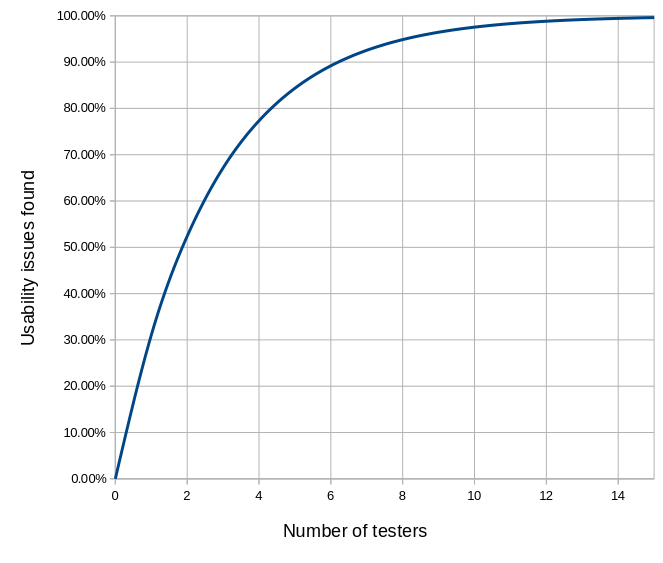
Note at five testers, you have uncovered about 85% of the issues. Nielsen’s curve suggests a diminishing return at higher numbers of testers. As you add testers, you’ll certainly discover more usability issues, but the increment gets smaller each time. Hence Nielsen’s recommendation for five testers.
Again, the reason that five is a good number is because of overlap of results. Each tester will help you identify a certain number of usability issues, given a good test design and high quality scenario tasks. The next tester will identify some of the same issues, plus a few others. And as you add testers, you’ll continue to have some overlap, and continue to expand into new territory.
Visualizing the overlap
Let me help you visualize this. We can create a simple program to show this overlap. I wrote a Bash script to generate SVG files with varying numbers of overlapping red squares. Each red square covers about 31% of the gray background.
#!/bin/bash

max=1
if [ $# -eq 1 ] ; then
  max="$1"
fi

cat<<EOF
<svg viewBox="0 0 819 819" xmlns="http://www.w3.org/2000/svg">
<rect x="0" y="0" width="819" height="819" style="fill:lightgray"/>
<!-- $max overlapping red squares -->
EOF

# iterate n-many red squares

# this assumes 819x819 gray square, and 456x456 red squares.
# the gray square has area 670761 and the red square has
# area 207936. That's 31.00001342% .. so basically L=31%.

# pick a starting x and y start value from 0-363 (that's 819-456)
# for each red square.

for n in $( seq 1 $max ) ; do
xrand=$(( $RANDOM % 363 ))
yrand=$(( $RANDOM % 363 ))

cat<<EOF
<rect x="$xrand" y="$yrand" width="456" height="456" style="fill:red;opacity:0.5"/>
EOF
done

cat<<EOF
</svg>
EOF
If you run this script, you should see output that looks something like this, for different values of n. Each image starts over; the iterations are not additive:
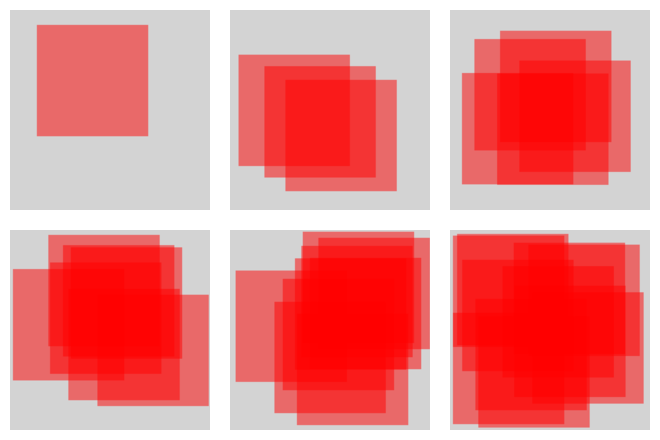
As you increase the number of testers, you cover more of the gray background. And you also have more overlap. The increase in coverage is quite dramatic from 1, 3, and 5 (top row), but compare 7, 9, and 11 (bottom row). Certainly there’s more coverage (and more overlap) at 9 than at 5, but not significantly more coverage. And the same goes from ten to fifteen.
These visuals aren’t meant to be an exact representation of the Nielsen iteration curve, but they do help show how adding more testers gives significant return up to a point, and then adding more testers doesn’t really get you much more.
“Good enough” results
The core takeaway is that it doesn’t take many testers to get results that are “good enough” to improve your design. The key idea is that you should do usability testing iteratively with your design process. I think every usability researcher would agree. Ellen Francik, writing for Human Factors (2015) refers to this process as the Rapid Iterative Testing and Evaluation (RITE) method, arguing “small tests are intended to deliver design guidance in a timely way throughout development.”
Don’t wait until the end to do your usability tests. By then, it’s probably too late to make substantive changes to your design, anyway. Instead, test your design as you go: create (or update) your design, do a usability test, tweak the design based on the results, test it again, tweak it again, and so on. After a few iterations, you will have a design that works well for most users.
More Stories
Make your first contribution to open source
Looking to get started in open source? Check out these opportunities.
Usability testing in open source software
Through usability testing, we can make open source software projects easier for everyone to use.
Speaking at Open Source 101
I will be speaking at Open Source 101 in Columbia, SC, on March 3. I will present an extended 3...