4 open source tools for Linux system monitoring
Last Updated on November 21, 2024 by David Both
Image by: Opensource.com
Information is the key to resolving any computer problem, including problems with or relating to Linux and the hardware on which it runs. There are many tools available for and included with most distributions even though they are not all installed by default. These tools can be used to obtain huge amounts of information.
This article discusses some of the interactive command line interface (CLI) tools that are provided with or which can be easily installed on Red Hat related distributions including Red Hat Enterprise Linux, Fedora, CentOS, and other derivative distributions. Although there are GUI tools available and they offer good information, the CLI tools provide all of the same information and they are always usable because many servers do not have a GUI interface but all Linux systems have a command line interface.
This article concentrates on the tools that I typically use. If I did not cover your favorite tool, please forgive me and let us all know what tools you use and why in the comments section.
Load averages
Before I go on to discuss the monitoring tools, it is important to discuss load averages in more detail.
Load averages are an important criteria for measuring CPU usage, but what does this really mean when I say that the 1 (or 5 or 10) minute load average is 4.04, for example? Load average can be considered a measure of demand for the CPU; it is a number that represents the average number of instructions waiting for CPU time. So this is a true measure of CPU performance, unlike the standard “CPU percentage” which includes I/O wait times during which the CPU is not really working.
For example, a fully utilized single processor system CPU would have a load average of 1. This means that the CPU is keeping up exactly with the demand; in other words it has perfect utilization. A load average of less than one means that the CPU is underutilized and a load average of greater than 1 means that the CPU is overutilized and that there is pent-up, unsatisfied demand. For example, a load average of 1.5 in a single CPU system indicates that one-third of the CPU instructions are forced to wait to be executed until the one preceding it has completed.
This is also true for multiple processors. If a 4 CPU system has a load average of 4 then it has perfect utilization. If it has a load average of 3.24, for example, then three of its processors are fully utilized and one is utilized at about 76%. In the example above, a 4 CPU system has a 1 minute load average of 4.04 meaning that there is no remaining capacity among the 4 CPUs and a few instructions are forced to wait. A perfectly utilized 4 CPU system would show a load average of 4.00 so that the system in the example is fully loaded but not overloaded.
The optimum condition for load average is for it to equal the total number of CPUs in a system. That would mean that every CPU is fully utilized and yet no instruction must be forced to wait. The longer-term load averages provide indication of the overall utilization trend.
Linux Journal has an excellent article describing load averages, the theory and the math behind them, and how to interpret them in the December 1, 2006 issue.
Signals
All of the monitors discussed here allow you to send signals to running processes. Each of these signals has a specific function though some of them can be defined by the receiving program using signal handlers.
The separate kill command can also be used to send signals to processes outside of the monitors. The kill -l can be used to list all possible signals that can be sent. Three of these signals can be used to kill a process.
- SIGTERM (15): Signal 15, SIGTERM is the default signal sent by top and the other monitors when the k key is pressed. It may also be the least effective because the program must have a signal handler built into it. The program’s signal handler must intercept incoming signals and act accordingly. So for scripts, most of which do not have signal handlers, SIGTERM is ignored. The idea behind SIGTERM is that by simply telling the program that you want it to terminate itself, it will take advantage of that and clean up things like open files and then terminate itself in a controlled and nice manner.
- SIGKILL (9): Signal 9, SIGKILL provides a means of killing even the most recalcitrant programs, including scripts and other programs that have no signal handlers. For scripts and other programs with no signal handler, however, it not only kills the running script but it also kills the shell session in which the script is running; this may not be the behavior that you want. If you want to kill a process and you don’t care about being nice, this is the signal you want. This signal cannot be intercepted by a signal handler in the program code.
- SIGINT (2): Signal 2, SIGINT can be used when SIGTERM does not work and you want the program to die a little more nicely, for example, without killing the shell session in which it is running. SIGINT sends an interrupt to the session in which the program is running. This is equivalent to terminating a running program, particularly a script, with the Ctrl-C key combination.
To experiment with this, open a terminal session and create a file in /tmp named cpuHog and make it executable with the permissions rwxr_xr_x (755). Add the following content to the file.
#!/bin/bash
# This little program is a cpu hog
X=0;while [ 1 ];do echo $X;X=$((X+1));done
Open another terminal session in a different window, position them adjacent to each other so you can watch the results and run top in the new session. Run the cpuHog program with the following command:/tmp/cpuHog
This program simply counts up by one and prints the current value of X to STDOUT. And it sucks up CPU cycles. The terminal session in which cpuHog is running should show a very high CPU usage in top. Observe the effect this has on system performance in top. CPU usage should immediately go way up and the load averages should also start to increase over time. If you want, you can open additional terminal sessions and start the cpuHog program in them so that you have multiple instances running.
Determine the PID of the cpuHog program you want to kill. Press the k key and look at the message under the Swap line at the bottom of the summary section. Top asks for the PID of the process you want to kill. Enter that PID and press Enter. Now top asks for the signal number and displays the default of 15. Try each of the signals described here and observe the results.
4 open source tools for Linux system monitoring
My go to tools for problem determination in a Linux environment are almost always the system monitoring tools. For me, these are top, atop, htop, and glances.
All of these tools monitor CPU and memory usage, and most of them list information about running processes at the very least. Some monitor other aspects of a Linux system as well. All provide near real-time views of system activity.
top
One of the first tools I use when performing problem determination is top. I like it because it has been around since forever and is always available while the other tools may not be installed.
The top program is a very powerful utility that provides a great deal of information about your running system. This includes data about memory usage, CPU loads, and a list of running processes including the amount of CPU time and memory being utilized by each process. Top displays system information in near real-time, updating (by default) every three seconds. Fractional seconds are allowed by top, although very small values can place a significant load the system. It is also interactive and the data columns to be displayed and the sort column can be modified.
A sample output from the top program is shown in Figure 1 below. The output from top is divided into two sections which are called the “summary” section, which is the top section of the output, and the “process” section which is the lower portion of the output; I will use this terminology for top, atop, htop and glances in the interest of consistency.
The top program has a number of useful interactive commands you can use to manage the display of data and to manipulate individual processes. Use the h command to view a brief help page for the various interactive commands. Be sure to press h twice to see both pages of the help. Use the q command to quit.
Summary section
The summary section of the output from top is an overview of the system status. The first line shows the system uptime and the 1, 5, and 15 minute load averages. In the example below, the load averages are 4.04, 4.17, and 4.06 respectively.
The second line shows the number of processes currently active and the status of each.
The lines containing CPU statistics are shown next. There can be a single line which combines the statistics for all CPUs present in the system, as in the example below, or one line for each CPU; in the case of the computer used for the example, this is a single quad core CPU. Press the 1 key to toggle between the consolidated display of CPU usage and the display of the individual CPUs. The data in these lines is displayed as percentages of the total CPU time available.
These and the other fields for CPU data are described below.
- us: userspace – Applications and other programs running in user space, i.e., not in the kernel.
- sy: system calls – Kernel level functions. This does not include CPU time taken by the kernel itself, just the kernel system calls.
- ni: nice – Processes that are running at a positive nice level.
- id: idle – Idle time, i.e., time not used by any running process.
- wa: wait – CPU cycles that are spent waiting for I/O to occur. This is wasted CPU time.
- hi: hardware interrupts – CPU cycles that are spent dealing with hardware interrupts.
- si: software interrupts – CPU cycles spent dealing with software-created interrupts such as system calls.
- st: steal time – The percentage of CPU cycles that a virtual CPU waits for a real CPU while the hypervisor is servicing another virtual processor.
The last two lines in the summary section are memory usage. They show the physical memory usage including both RAM and swap space.
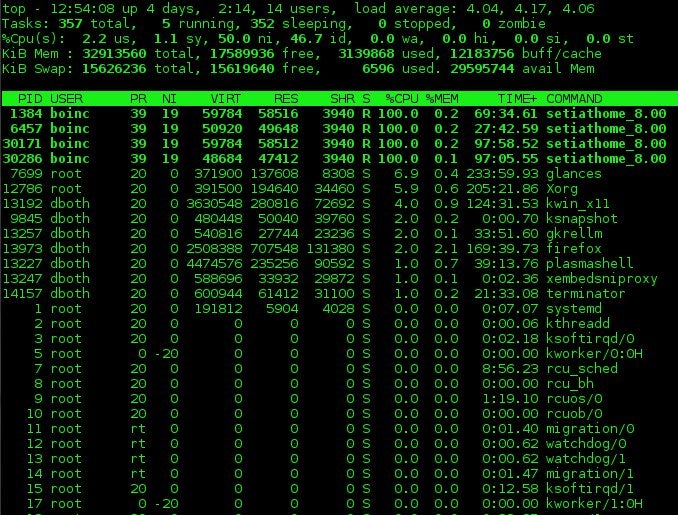
Figure 1: The top command showing a fully utilized 4-core CPU.
You can use the 1 command to display CPU statistics as a single, global number as shown in Figure 1, above, or by individual CPU. The l command turns load averages on and off. The t and m commands rotate the process/CPU and memory lines of the summary section, respectively, through off, text only, and a couple types of bar graph formats.
Process section
The process section of the output from top is a listing of the running processes in the system—at least for the number of processes for which there is room on the terminal display. The default columns displayed by top are described below. Several other columns are available and each can usually be added with a single keystroke. Refer to the top man page for details.
- PID – The Process ID.
- USER – The username of the process owner.
- PR – The priority of the process.
- NI – The nice number of the process.
- VIRT – The total amount of virtual memory allocated to the process.
- RES – Resident size (in kb unless otherwise noted) of non-swapped physical memory consumed by a process.
- SHR – The amount of shared memory in kb used by the process.
- S – The status of the process. This can be R for running, S for sleeping, and Z for zombie. Less frequently seen statuses can be T for traced or stopped, and D for uninterruptable sleep.
- %CPU – The percentage of CPU cycles, or time used by this process during the last measured time period.
- %MEM – The percentage of physical system memory used by the process.
- TIME+ – Total CPU time to 100ths of a second consumed by the process since the process was started.
- COMMAND – This is the command that was used to launch the process.
Use the Page Up and Page Down keys to scroll through the list of running processes. The d or s commands are interchangeable and can be used to set the delay interval between updates. The default is three seconds, but I prefer a one second interval. Interval granularity can be as low as one-tenth (0.1) of a second but this will consume more of the CPU cycles you are trying to measure.
You can use the < and > keys to sequence the sort column to the left or right.
The k command is used to kill a process or the r command to renice it. You have to know the process ID (PID) of the process you want to kill or renice and that information is displayed in the process section of the top display. When killing a process, top asks first for the PID and then for the signal number to use in killing the process. Type them in and press the enter key after each. Start with signal 15, SIGTERM, and if that does not kill the process, use 9, SIGKILL.
Configuration
If you alter the top display, you can use the W (in uppercase) command to write the changes to the configuration file, ~/.toprc in your home directory.
atop
I also like atop. It is an excellent monitor to use when you need more details about that type of I/O activity. The default refresh interval is 10 seconds, but this can be changed using the interval i command to whatever is appropriate for what you are trying to do. atop cannot refresh at sub-second intervals like top can.
Use the h command to display help. Be sure to notice that there are multiple pages of help and you can use the space bar to scroll down to see the rest.
One nice feature of atop is that it can save raw performance data to a file and then play it back later for close inspection. This is handy for tracking down internmittent problems, especially ones that occur during times when you cannot directly monitor the system. The atopsar program is used to play back the data in the saved file.
 .
.
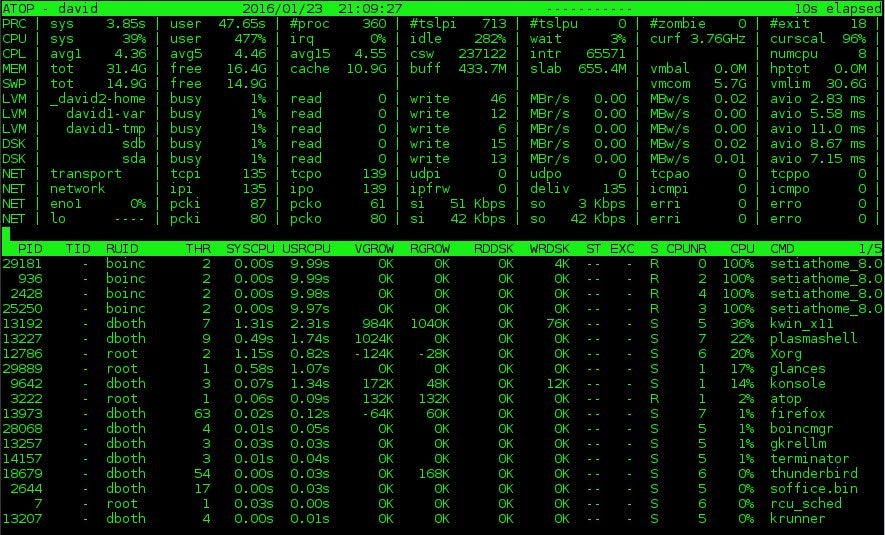
Figure 2: The atop system monitor provides information about disk and network activity in addition to CPU and process data.
Summary section
atop contains much of the same information as top but also displays information about network, raw disk, and logical volume activity. Figure 2, above, shows these additional data in the columns at the top of the display. Note that if you have the horizontal screen real-estate to support a wider display, additional columns will be displayed. Conversely, if you have less horizontal width, fewer columns are displayed. I also like that atop displays the current CPU frequency and scaling factor—something I have not seen on any other of these monitors—on the second line in the rightmost two columns in Figure 2.
Process section
The atop process display includes some of the same columns as that for top, but it also includes disk I/O information and thread count for each process as well as virtual and real memory growth statistics for each process. As with the summary section, additional columns will display if there is sufficient horizontal screen real-estate. For example, in Figure 2, the RUID (Real User ID) of the process owner is displayed. Expanding the display will also show the EUID (Effective User ID) which might be important when programs run SUID (Set User ID).
atop can also provide detailed information about disk, memory, network, and scheduling information for each process. Just press the d, m, n or s keys respectively to view that data. The g key returns the display to the generic process display.
Sorting can be accomplished easily by using C to sort by CPU usage, M for memory usage, D for disk usage, N for network usage and A for automatic sorting. Automatic sorting usually sorts processes by the most busy resource. The network usage can only be sorted if the netatop kernel module is installed and loaded.
You can use the k key to kill a process but there is no option to renice a process.
By default, network and disk devices for which no activity occurs during a given time interval are not displayed. This can lead to mistaken assumptions about the hardware configuration of the host. The f command can be used to force atop to display the idle resources.
Configuration
The atop man page refers to global and user level configuration files, but none can be found in my own Fedora or CentOS installations. There is also no command to save a modified configuration and a save does not take place automatically when the program is terminated. So, there appears to be now way to make configuration changes permanent.
htop
The htop program is much like top but on steroids. It does look a lot like top, but it also provides some capabilities that top does not. Unlike atop, however, it does not provide any disk, network, or I/O information of any type.
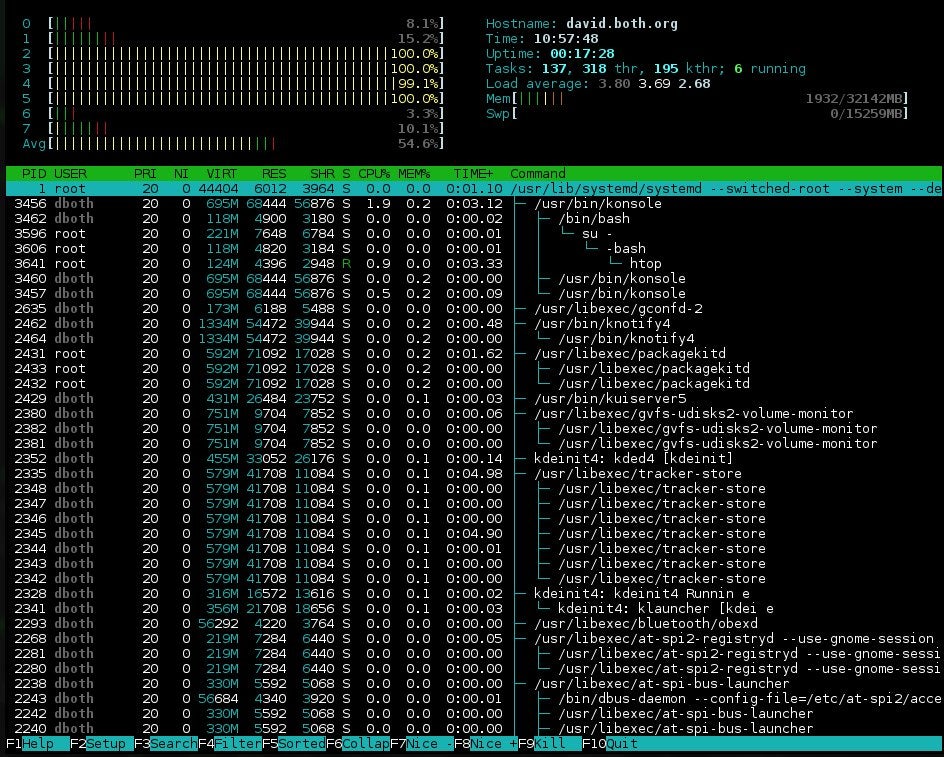
Figure 3: htop has nice bar charts to to indicate resource usage and it can show the process tree.
Summary section
The summary section of htop is displayed in two columns. It is very flexible and can be configured with several different types of information in pretty much any order you like. Although the CPU usage sections of top and atop can be toggled between a combined display and a display that shows one bar graph for each CPU, htop cannot. So it has a number of different options for the CPU display, including a single combined bar, a bar for each CPU, and various combinations in which specific CPUs can be grouped together into a single bar.
I think this is a cleaner summary display than some of the other system monitors and it is easier to read. The drawback to this summary section is that some information is not available in htop that is available in the other monitors, such as CPU percentages by user, idle, and system time.
The F2 (Setup) key is used to configure the summary section of htop. A list of available data displays is shown and you can use function keys to add them to the left or right column and to move them up and down within the selected column.
Process section
The process section of htop is very similar to that of top. As with the other monitors, processes can be sorted any of several factors, including CPU or memory usage, user, or PID. Note that sorting is not possible when the tree view is selected.
The F6 key allows you to select the sort column; it displays a list of the columns available for sorting and you select the column you want and press the Enter key.
You can use the up and down arrow keys to select a process. To kill a process, use the up and down arrow keys to select the target process and press the k key. A list of signals to send the process is displayed with 15, SIGTERM, selected. You can specify the signal to use, if different from SIGTERM. You could also use the F7 and F8 keys to renice the selected process.
One command I especially like is F5 which displays the running processes in a tree format making it easy to determine the parent/child relationships of running processes.
Configuration
Each user has their own configuration file, ~/.config/htop/htoprc and changes to the htop configuration are stored there automatically. There is no global configuration file for htop.
glances
I have just recently learned about glances, which can display more information about your computer than any of the other monitors I am currently familiar with. This includes disk and network I/O, thermal readouts that can display CPU and other hardware temperatures as well as fan speeds, and disk usage by hardware device and logical volume.
The drawback to having all of this information is that glances uses a significant amount of CPU resurces itself. On my systems I find that it can use from about 10% to 18% of CPU cycles. That is a lot so you should consider that impact when you choose your monitor.
Summary section
The summary section of glances contains most of the same information as the summary sections of the other monitors. If you have enough horizontal screen real estate it can show CPU usage with both a bar graph and a numeric indicator, otherwise it will show only the number.
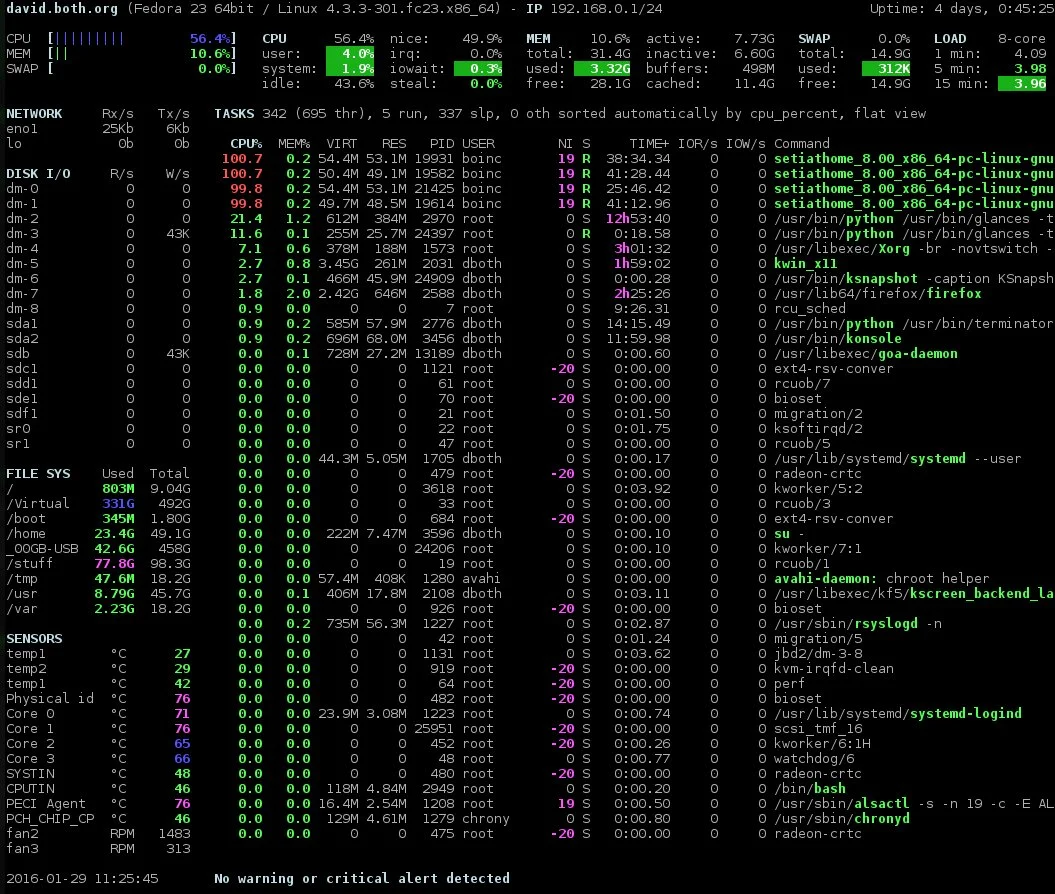
Figure 4: The glances interface with network, disk, filesystem, and sensor information.
I like this summary section better than those of the other monitors; I think it provides the right information in an easily understandable format. As with atop and htop, you can press the 1 key to toggle between a display of the individual CPU cores or a global one with all of the CPU cores as a single average as shown in Figure 4, above.
Process section
The process section displays the standard information about each of the running processes. Processes can be sorted automatically a, or by CPU c, memory m, name p, user u, I/O rate i, or time t. When sorted automatically processes are first sorted by the most used resource.
Glances also shows warnings and critical alerts at the very bottom of the screen, including the time and duration of the event. This can be helpful when attempting to diagnose problems when you cannot stare at the screen for hours at a time. These alert logs can be toggled on or off with the l command, warnings can be cleared with the w command while alerts and warnings can all be cleared with x.
It is interesting that glances is the only one of these monitors that cannot be used to either kill or renice a process. It is intended strictly as a monitor. You can use the external kill and renice commands to manipulate processes.
Sidebar
Glances has a very nice sidebar that displays information that is not available in top or htop. Atop does display some of this data, but glances is the only monitor that displays the sensors data. Sometimes it is nice to see the temperatures inside your computer. The individual modules, disk, filesystem, network, and sensors can be toggled on and off using the d,f, n, and s commands, respectively. The entire sidebar can be toggled using 2.
Docker stats can be displayed with D.
Configuration
Glances does not require a configuration file to work properly. If you choose to have one, the system-wide instance of the configuration file would be located in /etc/glances/glances.conf. Individual users can have a local instance at ~/.config/glances/glances.conf which will override the global configuration. The primary purpose of these configuration files is to set thresholds for warnings and critical alerts. There is no way I can find to make other configuration changes—such as sidebar modules or the CPU displays—permanent. It appears that you must reconfigure those items every time you start glances.
There is a document, /usr/share/doc/glances/glances-doc.html, that provides a great deal of information about using glances, and it explicitly states that you can use the configuration file to configure which modules are displayed. However, neither the information given nor the examples describe just how to do that.
Conclusion
Be sure to read the man pages for each of these monitors because there is a large amount of information about configuring and interacting with them. Also use the h key for help in interactive mode. This help can provide you with information about selecting and sorting the columns of data, setting the update interval and much more.
These programs can tell you a great deal when you are looking for the cause of a problem. They can tell you when a process, and which one, is sucking up CPU time, whether there is enough free memory, whether processes are stalled while waiting for I/O such as disk or network access to complete, and much more.
I strongly recommend that you spend time watching these monitoring programs while they run on a system that is functioning normally so you will be able to differentiate those things that may be abnormal while you are looking for the cause of a problem.
You should also be aware that the act of using these monitoring tools alters the system’s use of resources including memory and CPU time. top and most of these monitors use perhaps 2% or 3% of a system’s CPU time. glances has much more impact than the others and can use between 10% and 20% of CPU time. Be sure to consider this when choosing your tools.
I had originally intended to include SAR (System Activity Reporter) in this article but as this article grew longer it also became clear to me that SAR is significantly different from these monitoring tools and deserves to have a separate article. So with that in mind, I wrote an article on SAR and the /proc filesystem.